Reports
Every report follows the same anatomy, so that moving from one to another does not mean relearning the screen:
- a filter bar at the top — Application, Interface, Definition and period — with the number of active filters and a clear button;
- total cards right below, always computed over the already-filtered set: the big number and the list below never disagree;
- the list, grouped by Application where that makes sense, with the sorting you choose.
Changing the filter recalculates the cards along with the list. A total that ignored the filter would look like “the official number” and lead to a wrong conclusion on every reading. The exception is a card that explicitly speaks of the present — “Blocked now”, for instance, is the state of this moment, not of the period.
Daily X-Ray — /reports/daily-summary
Yesterday closed out: what came in, what went out, what failed, who was down and what got stuck — with every number linking to the screen where the problem gets fixed. It is the one report that is not recalculated: it is a picture written at closing time, and that is what keeps the screen and the nightly e-mail from ever disagreeing.
AI Sessions — /reports/ai-sessions
Every conversation with the product’s AI, with the moderation tag and the reviewed mark.
Availability — /reports/application-availability
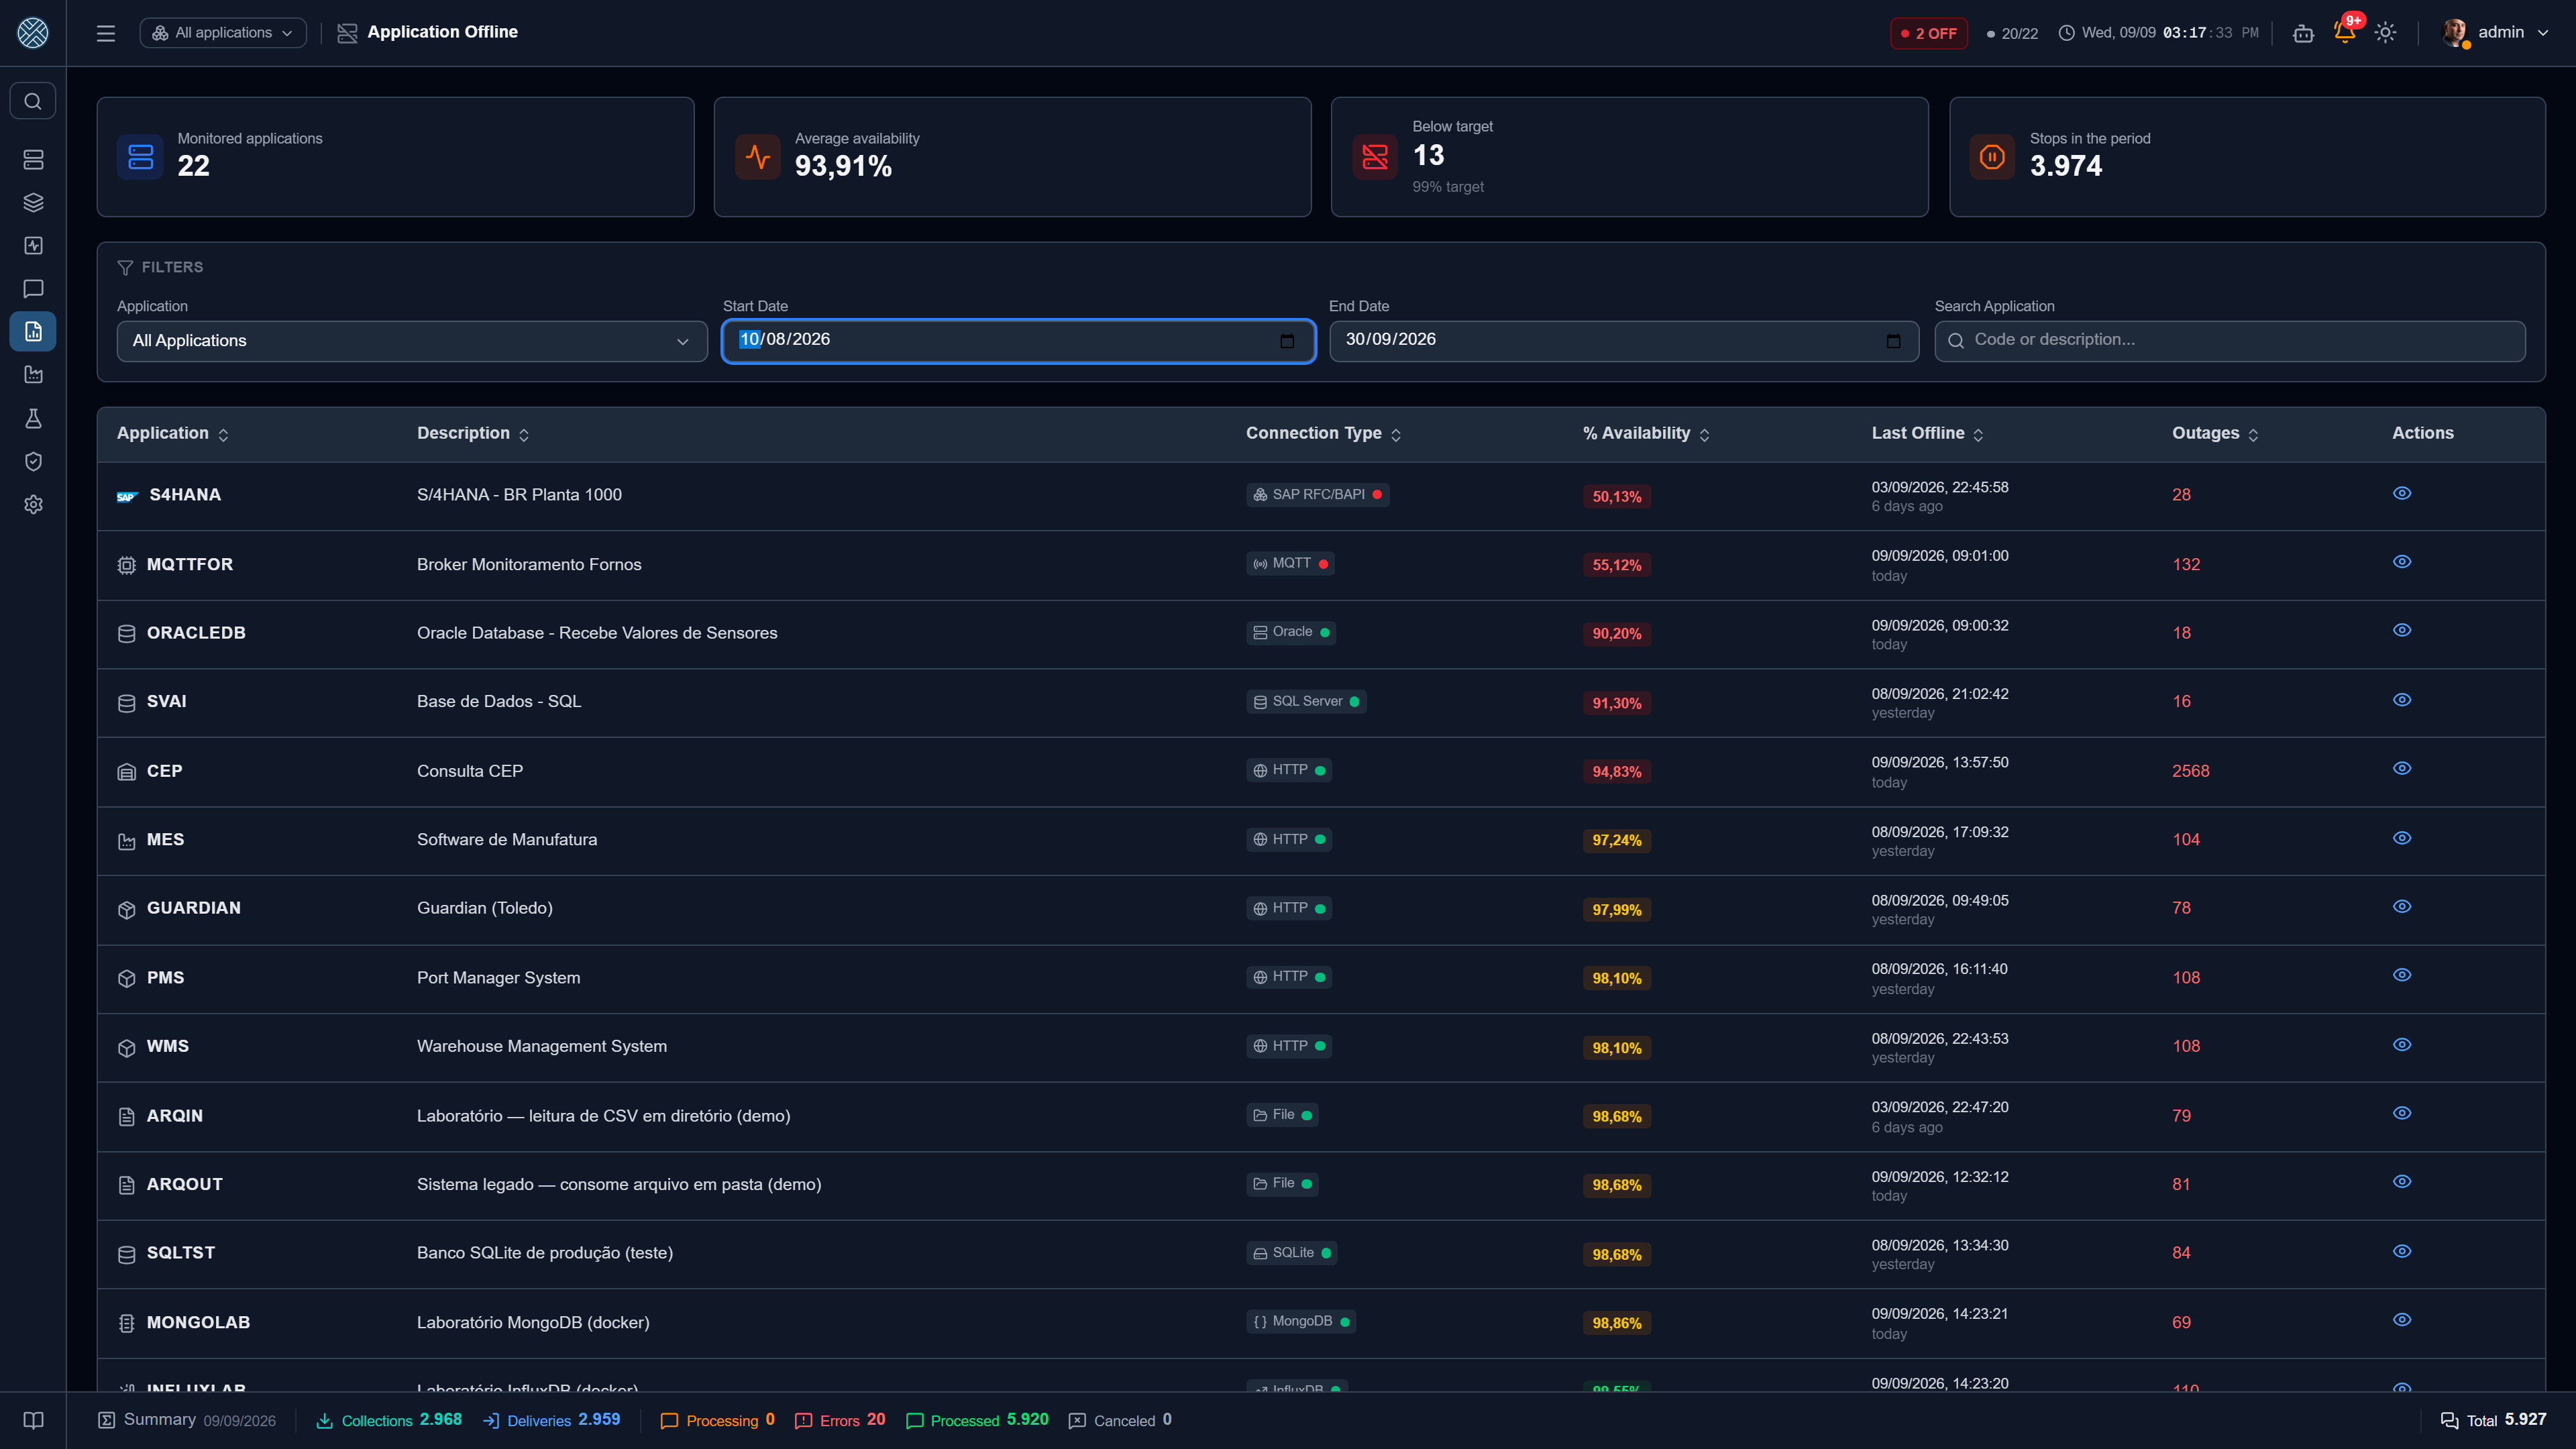
Uptime and downtime per application, derived from keep-alive signals. The detail
(/reports/application-availability/:id) brings the downtime timeline, with annotations and the
stop reason attached to each window — which separates planned stops from
incidents.
Interface Blocking — /reports/interface-blocking
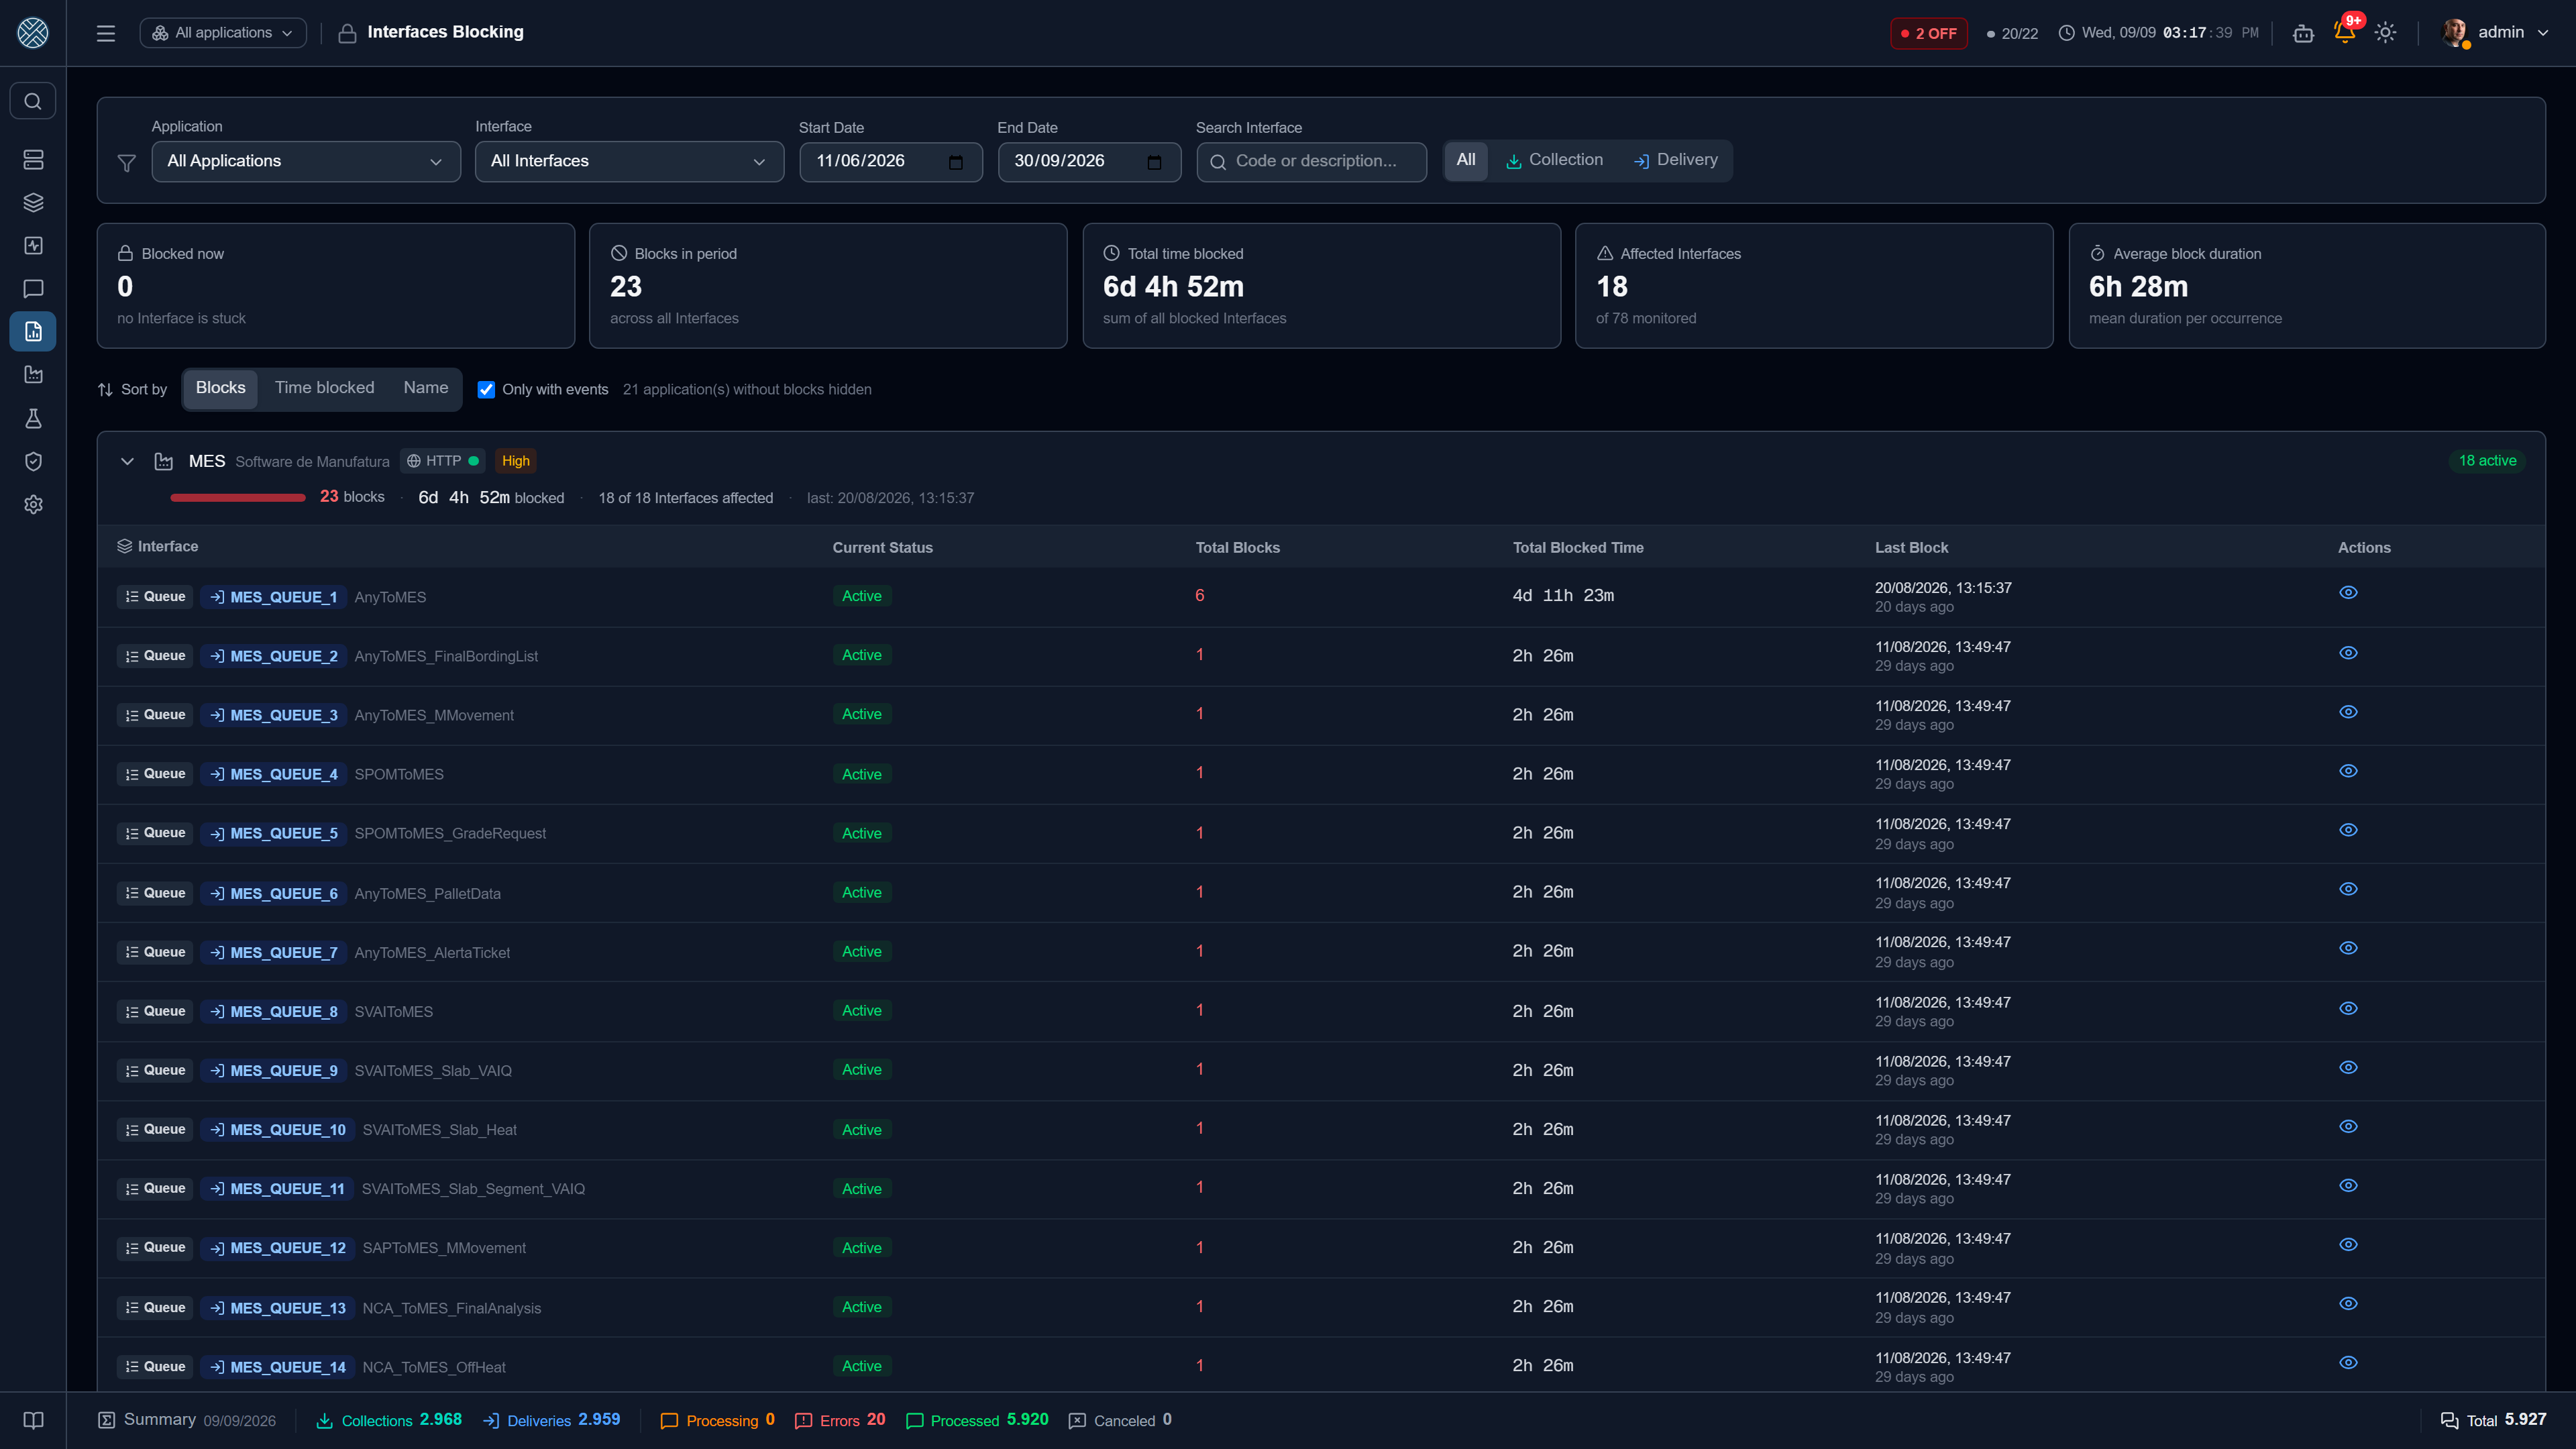
How many blocks each interface had in the period and how long in total it stayed blocked. Beside each row, a proportion bar shows that interface’s weight in the total — turning a table of numbers into a reading of “where the problem is” without comparing values by eye.
The grouping by Application can be re-sorted by Blocks, Time blocked or Name: these are different questions, and the interface that trips many times briefly is rarely the one that sits idle for a whole shift. The Only with events checkbox hides Applications with no blocks at all in the period — and says how many it hid, so silence is not mistaken for a badly set filter.
The detail (/reports/interface-blocking/:id) shows the block/unblock history with the origin
(manual or automatic from a business error) and who was responsible.
Business Errors — /reports/business-errors
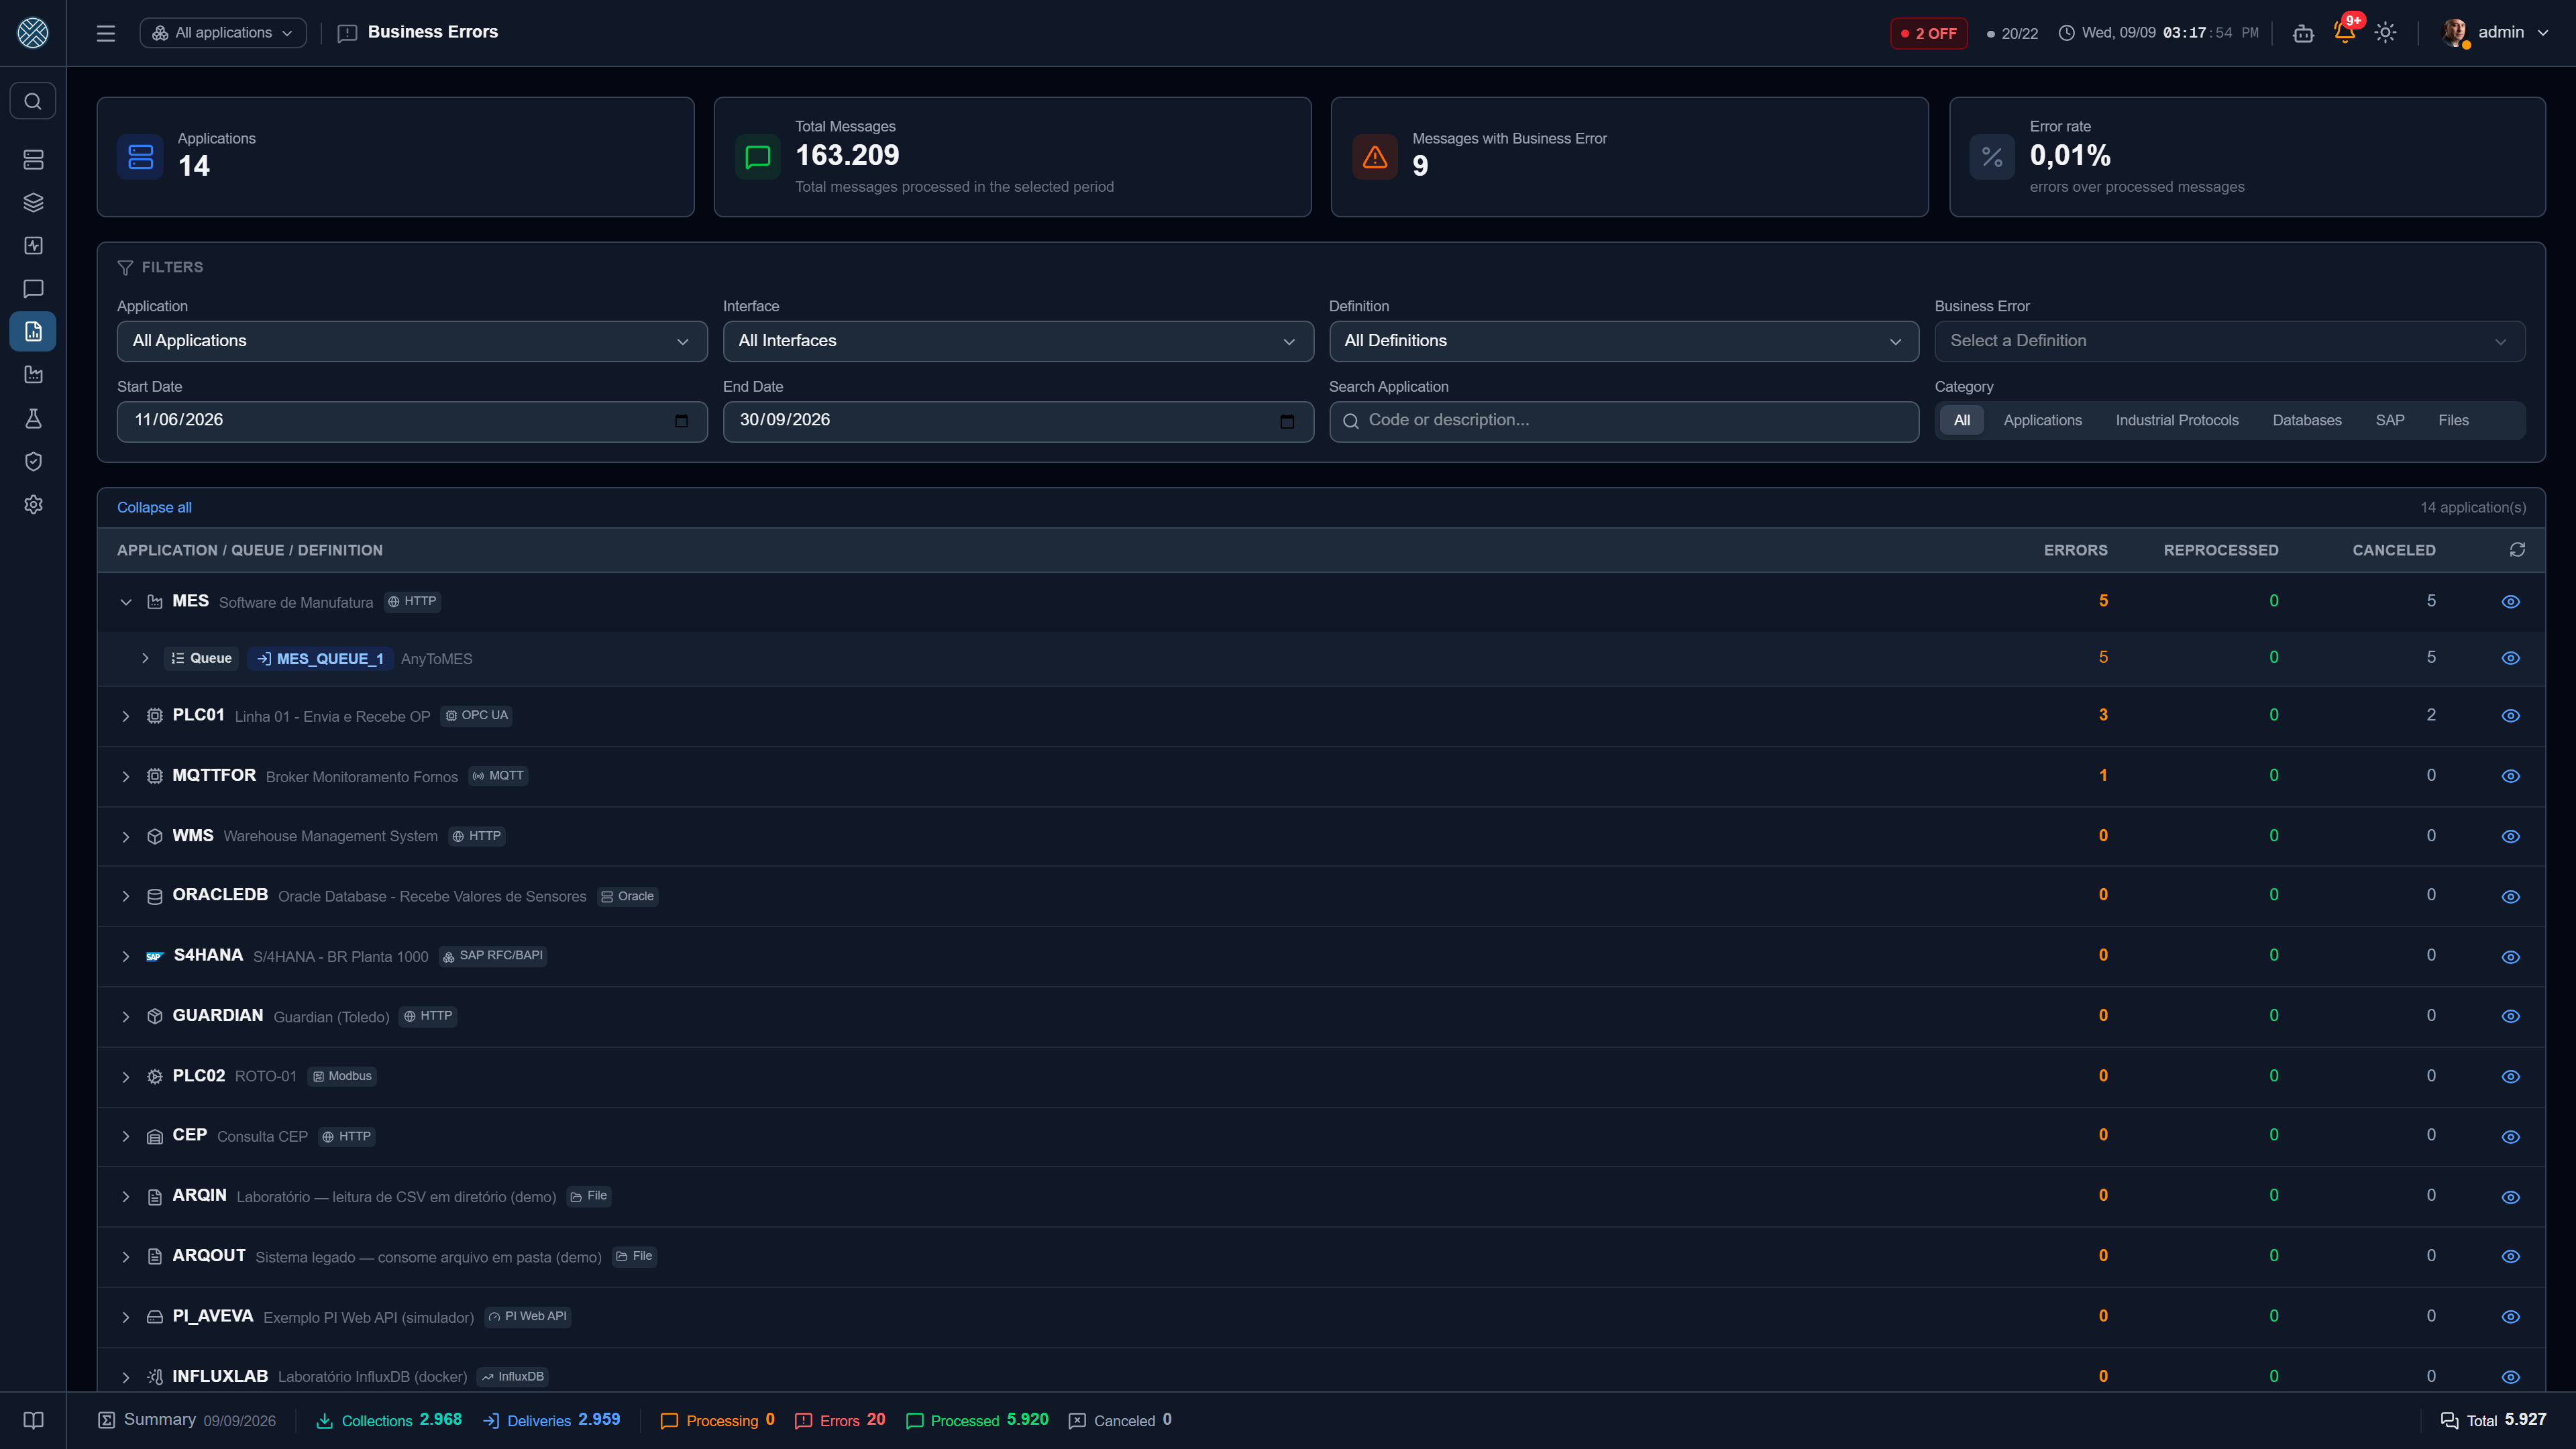
Messages classified as business errors, grouped by application, interface and definition. Use it to find the rule that fires the most — usually the symptom of a data problem at the source.
Storage Usage — /reports/storage-usage
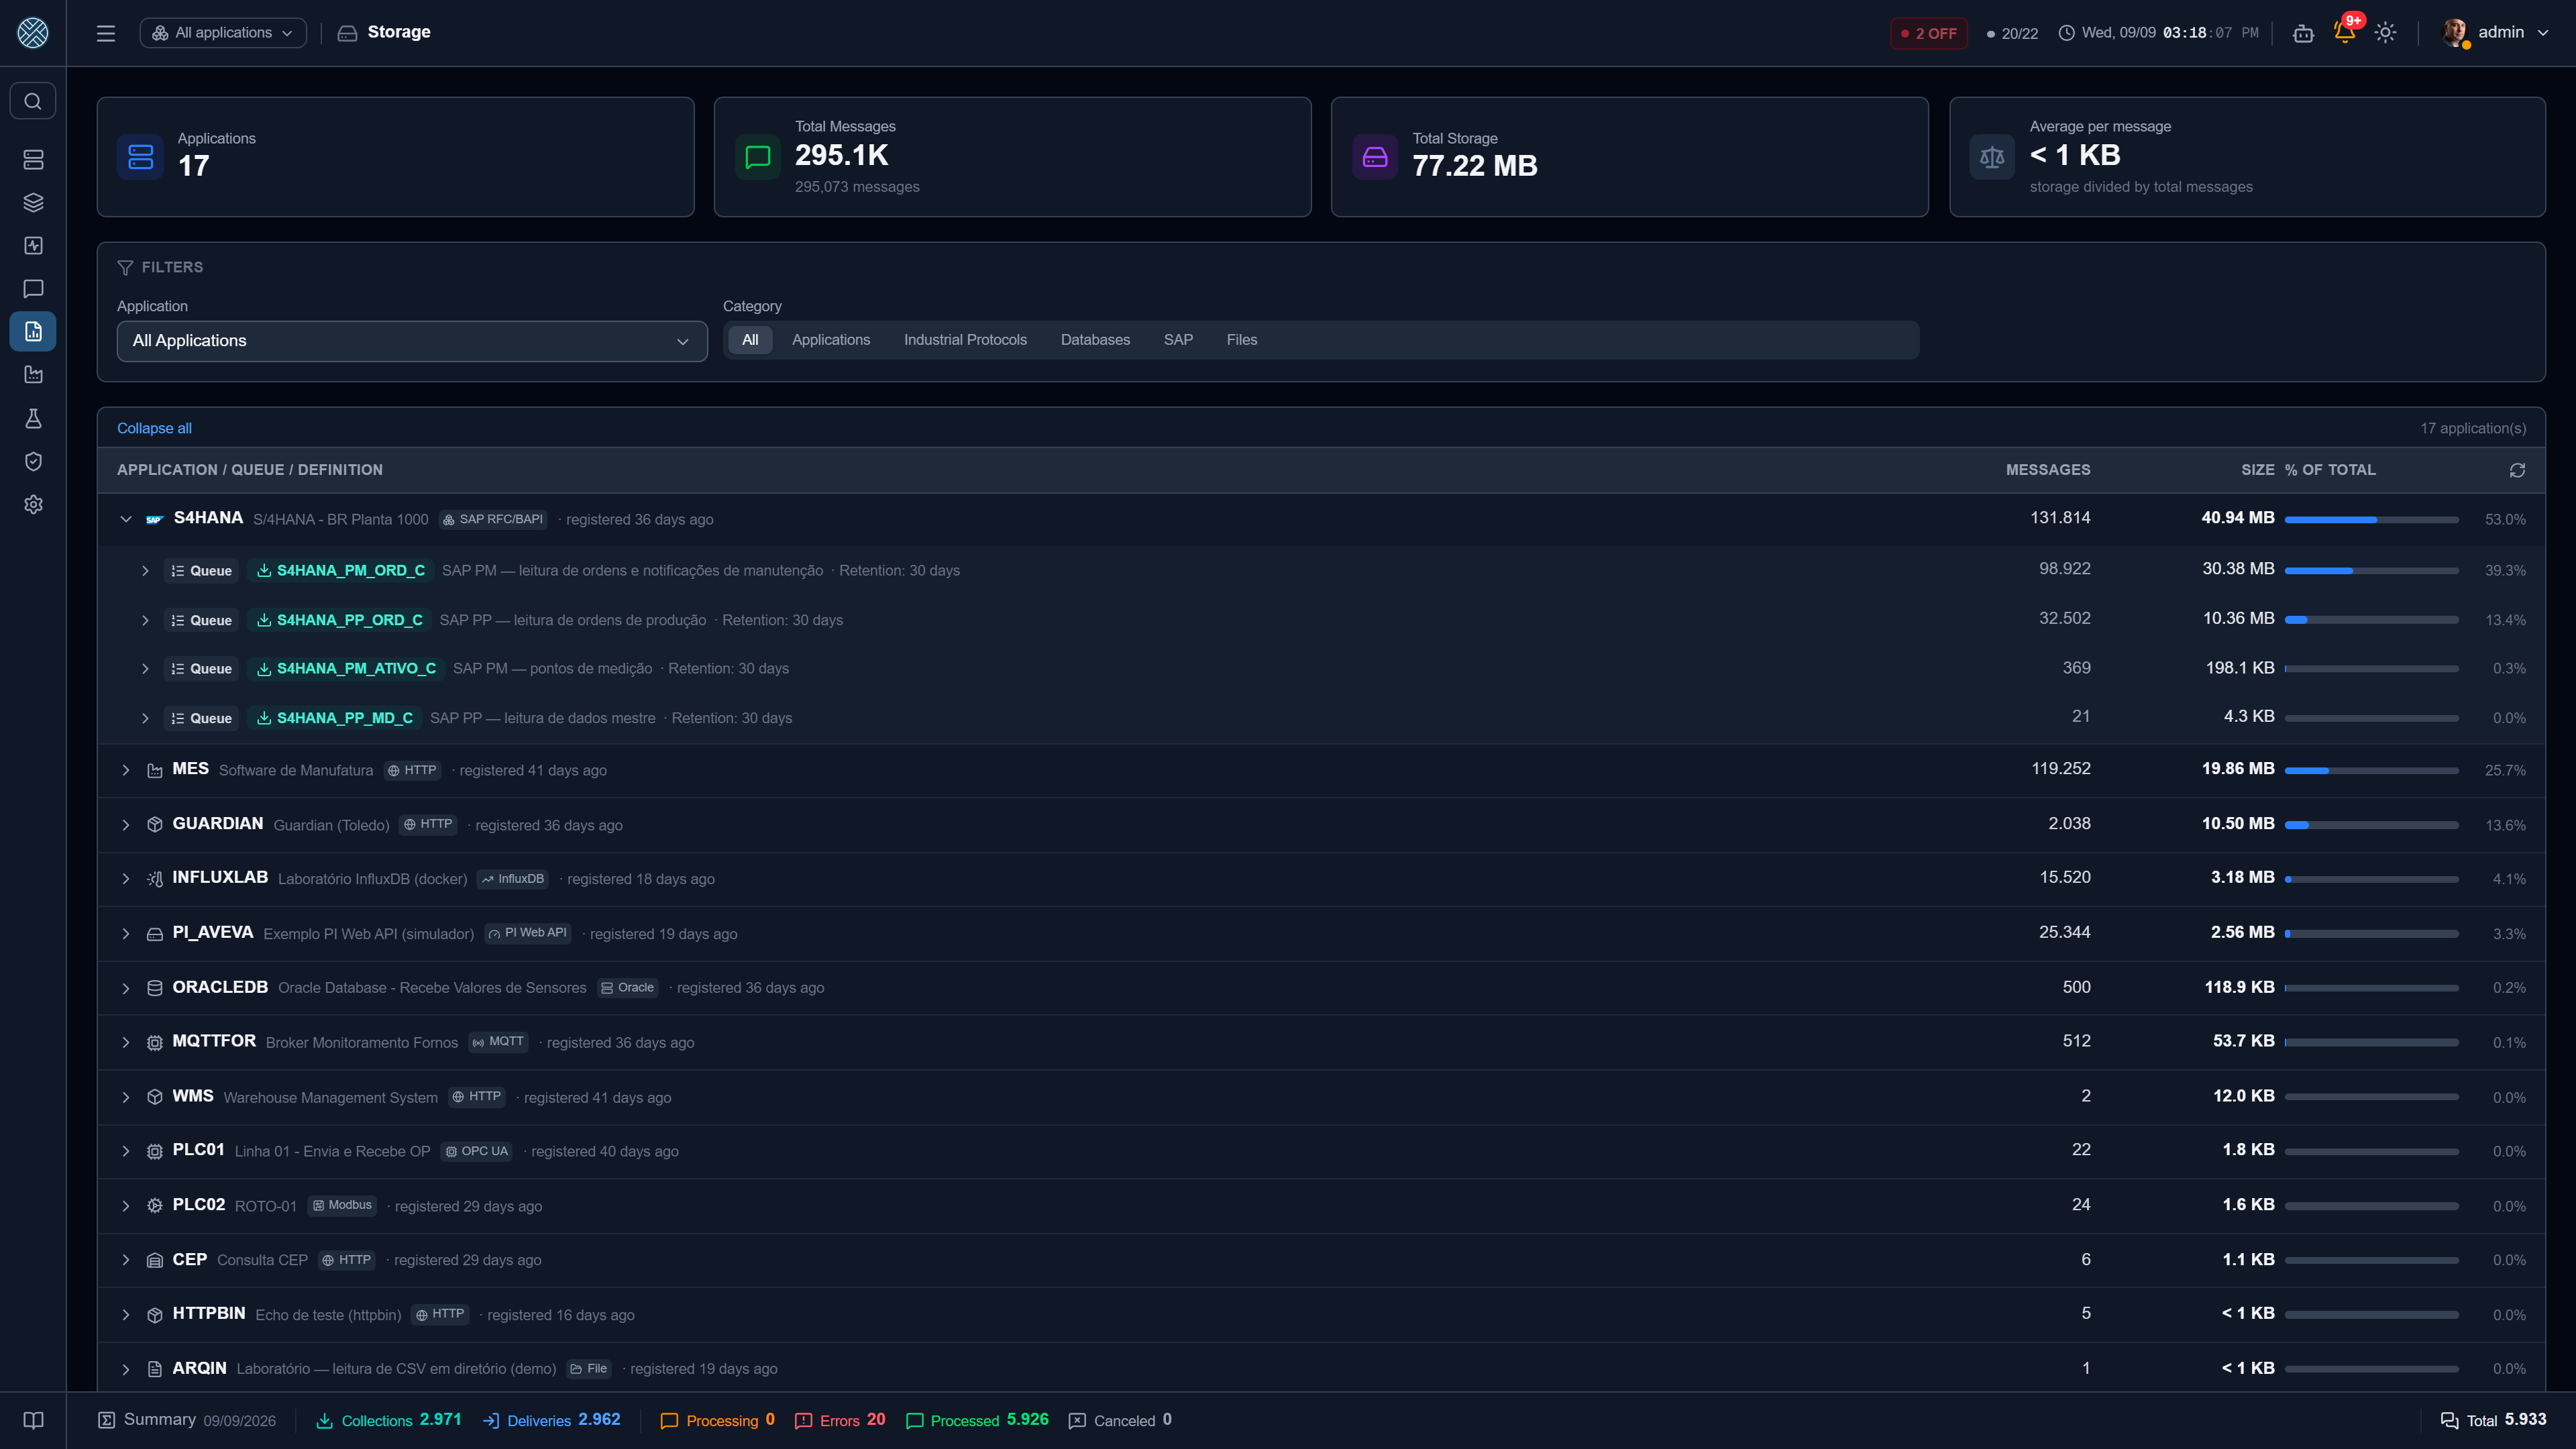
Message and byte volume across the Application → Interface → Definition hierarchy, with each Interface’s retention days alongside. It is the screen for answering “who is filling the database?” before tuning retention — which is configured per Interface, in Configuration.
Scheduler History — /reports/scheduler-history
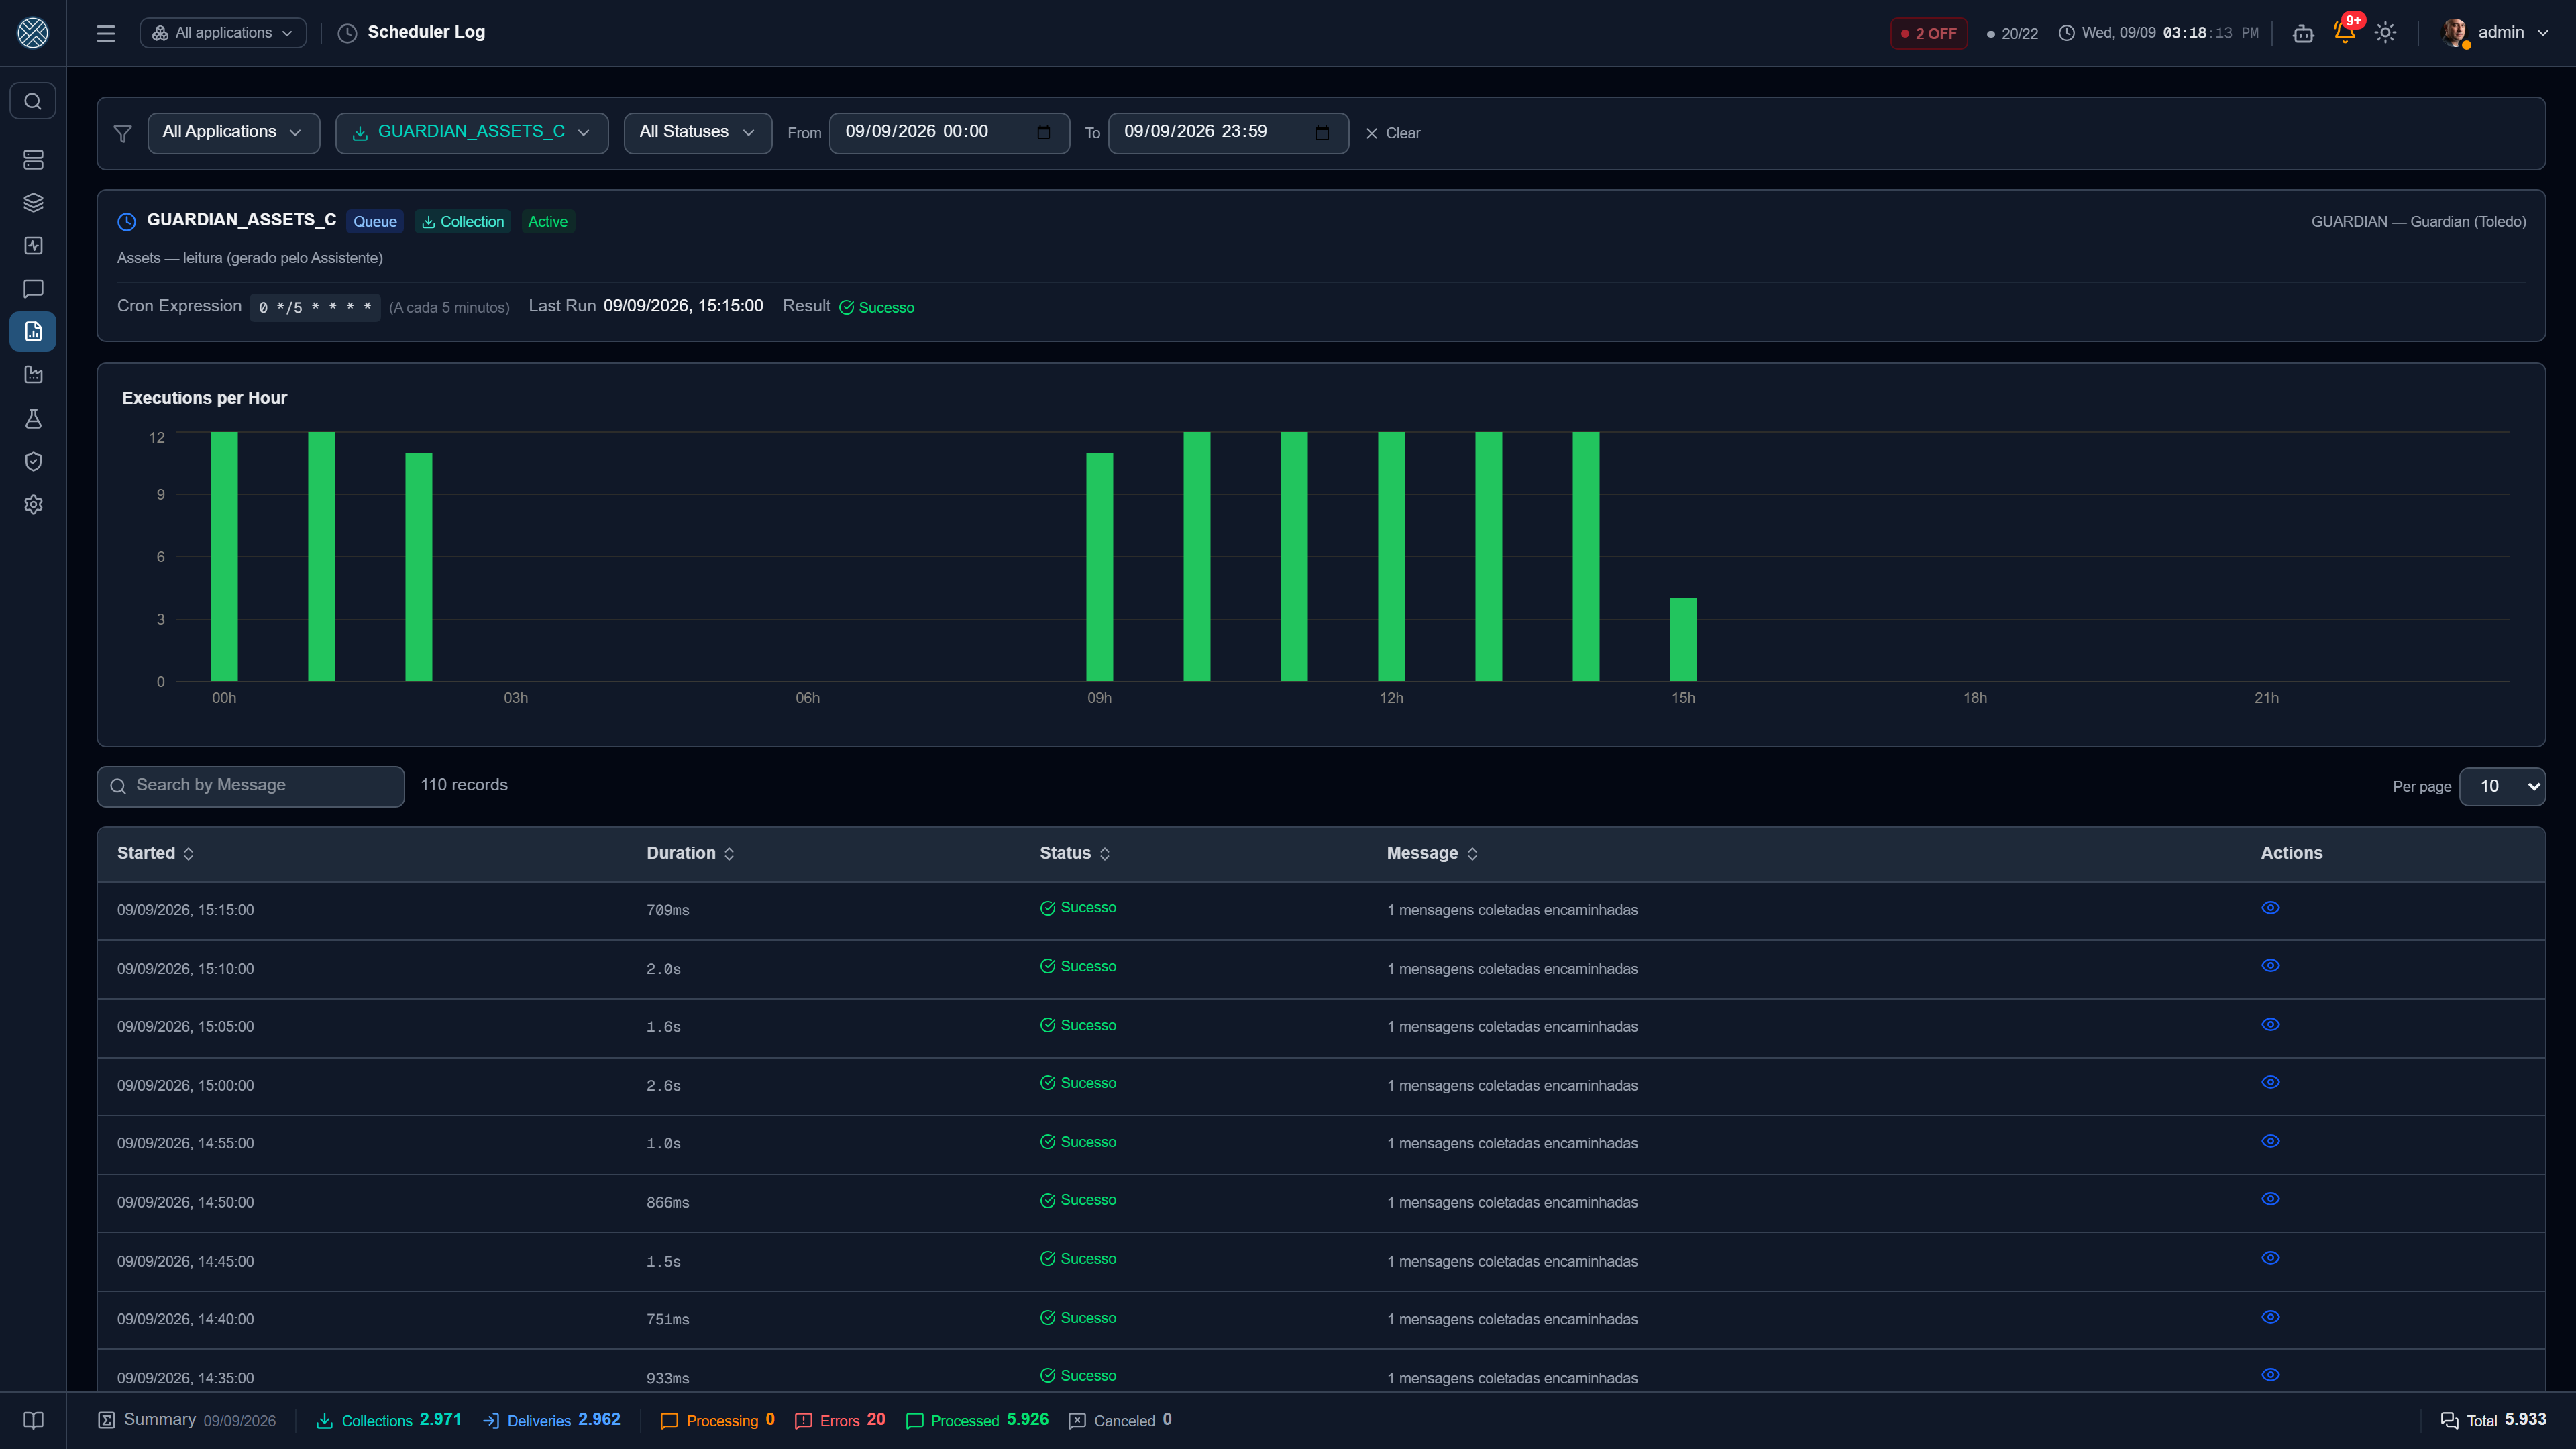
Past job executions: timestamp, duration, outcome and message. It offers filters by job, status and period, a chart of executions per hour — usually the fastest way to see what time something stopped — and, for each execution, the list of messages involved.
The period here is one day, because the chart is by hour of the day: the selector offers Today, Yesterday and the custom range, which does not let the end fall on another day.
Collection Log — /reports/collection-log
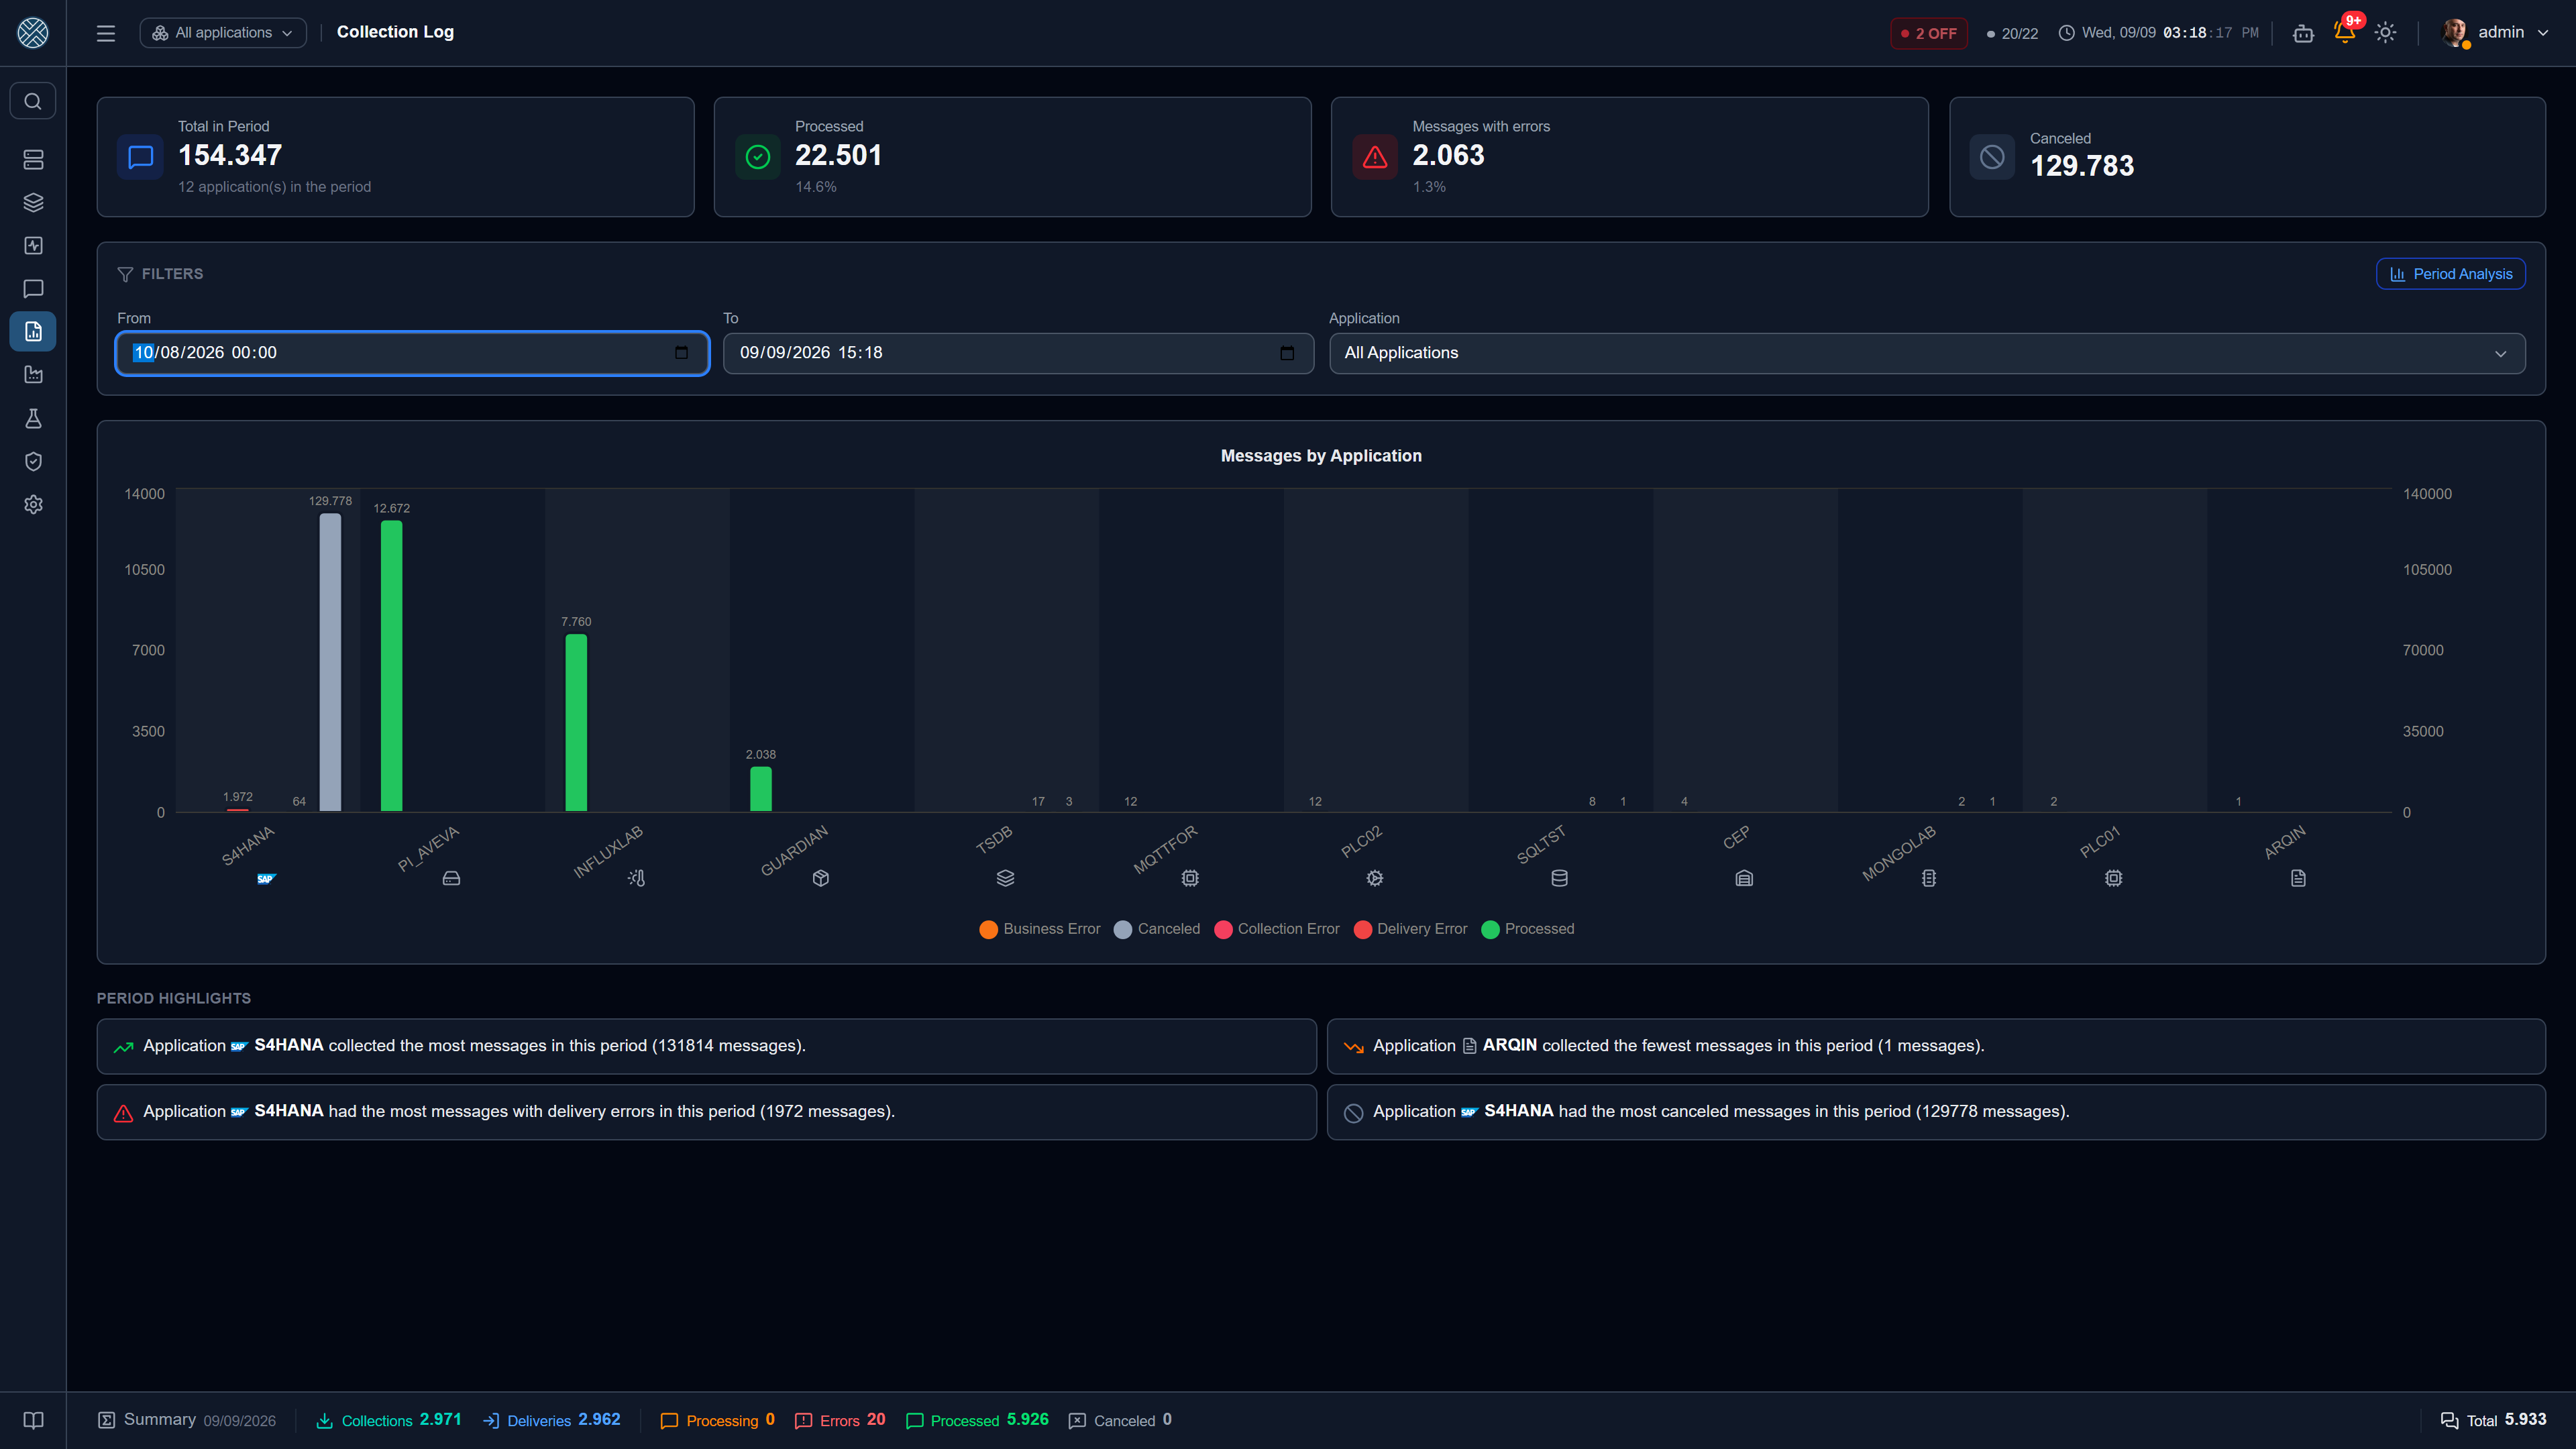
History of collector executions, with the outcome of reading the source.
Shipping Log — /reports/shipping-log
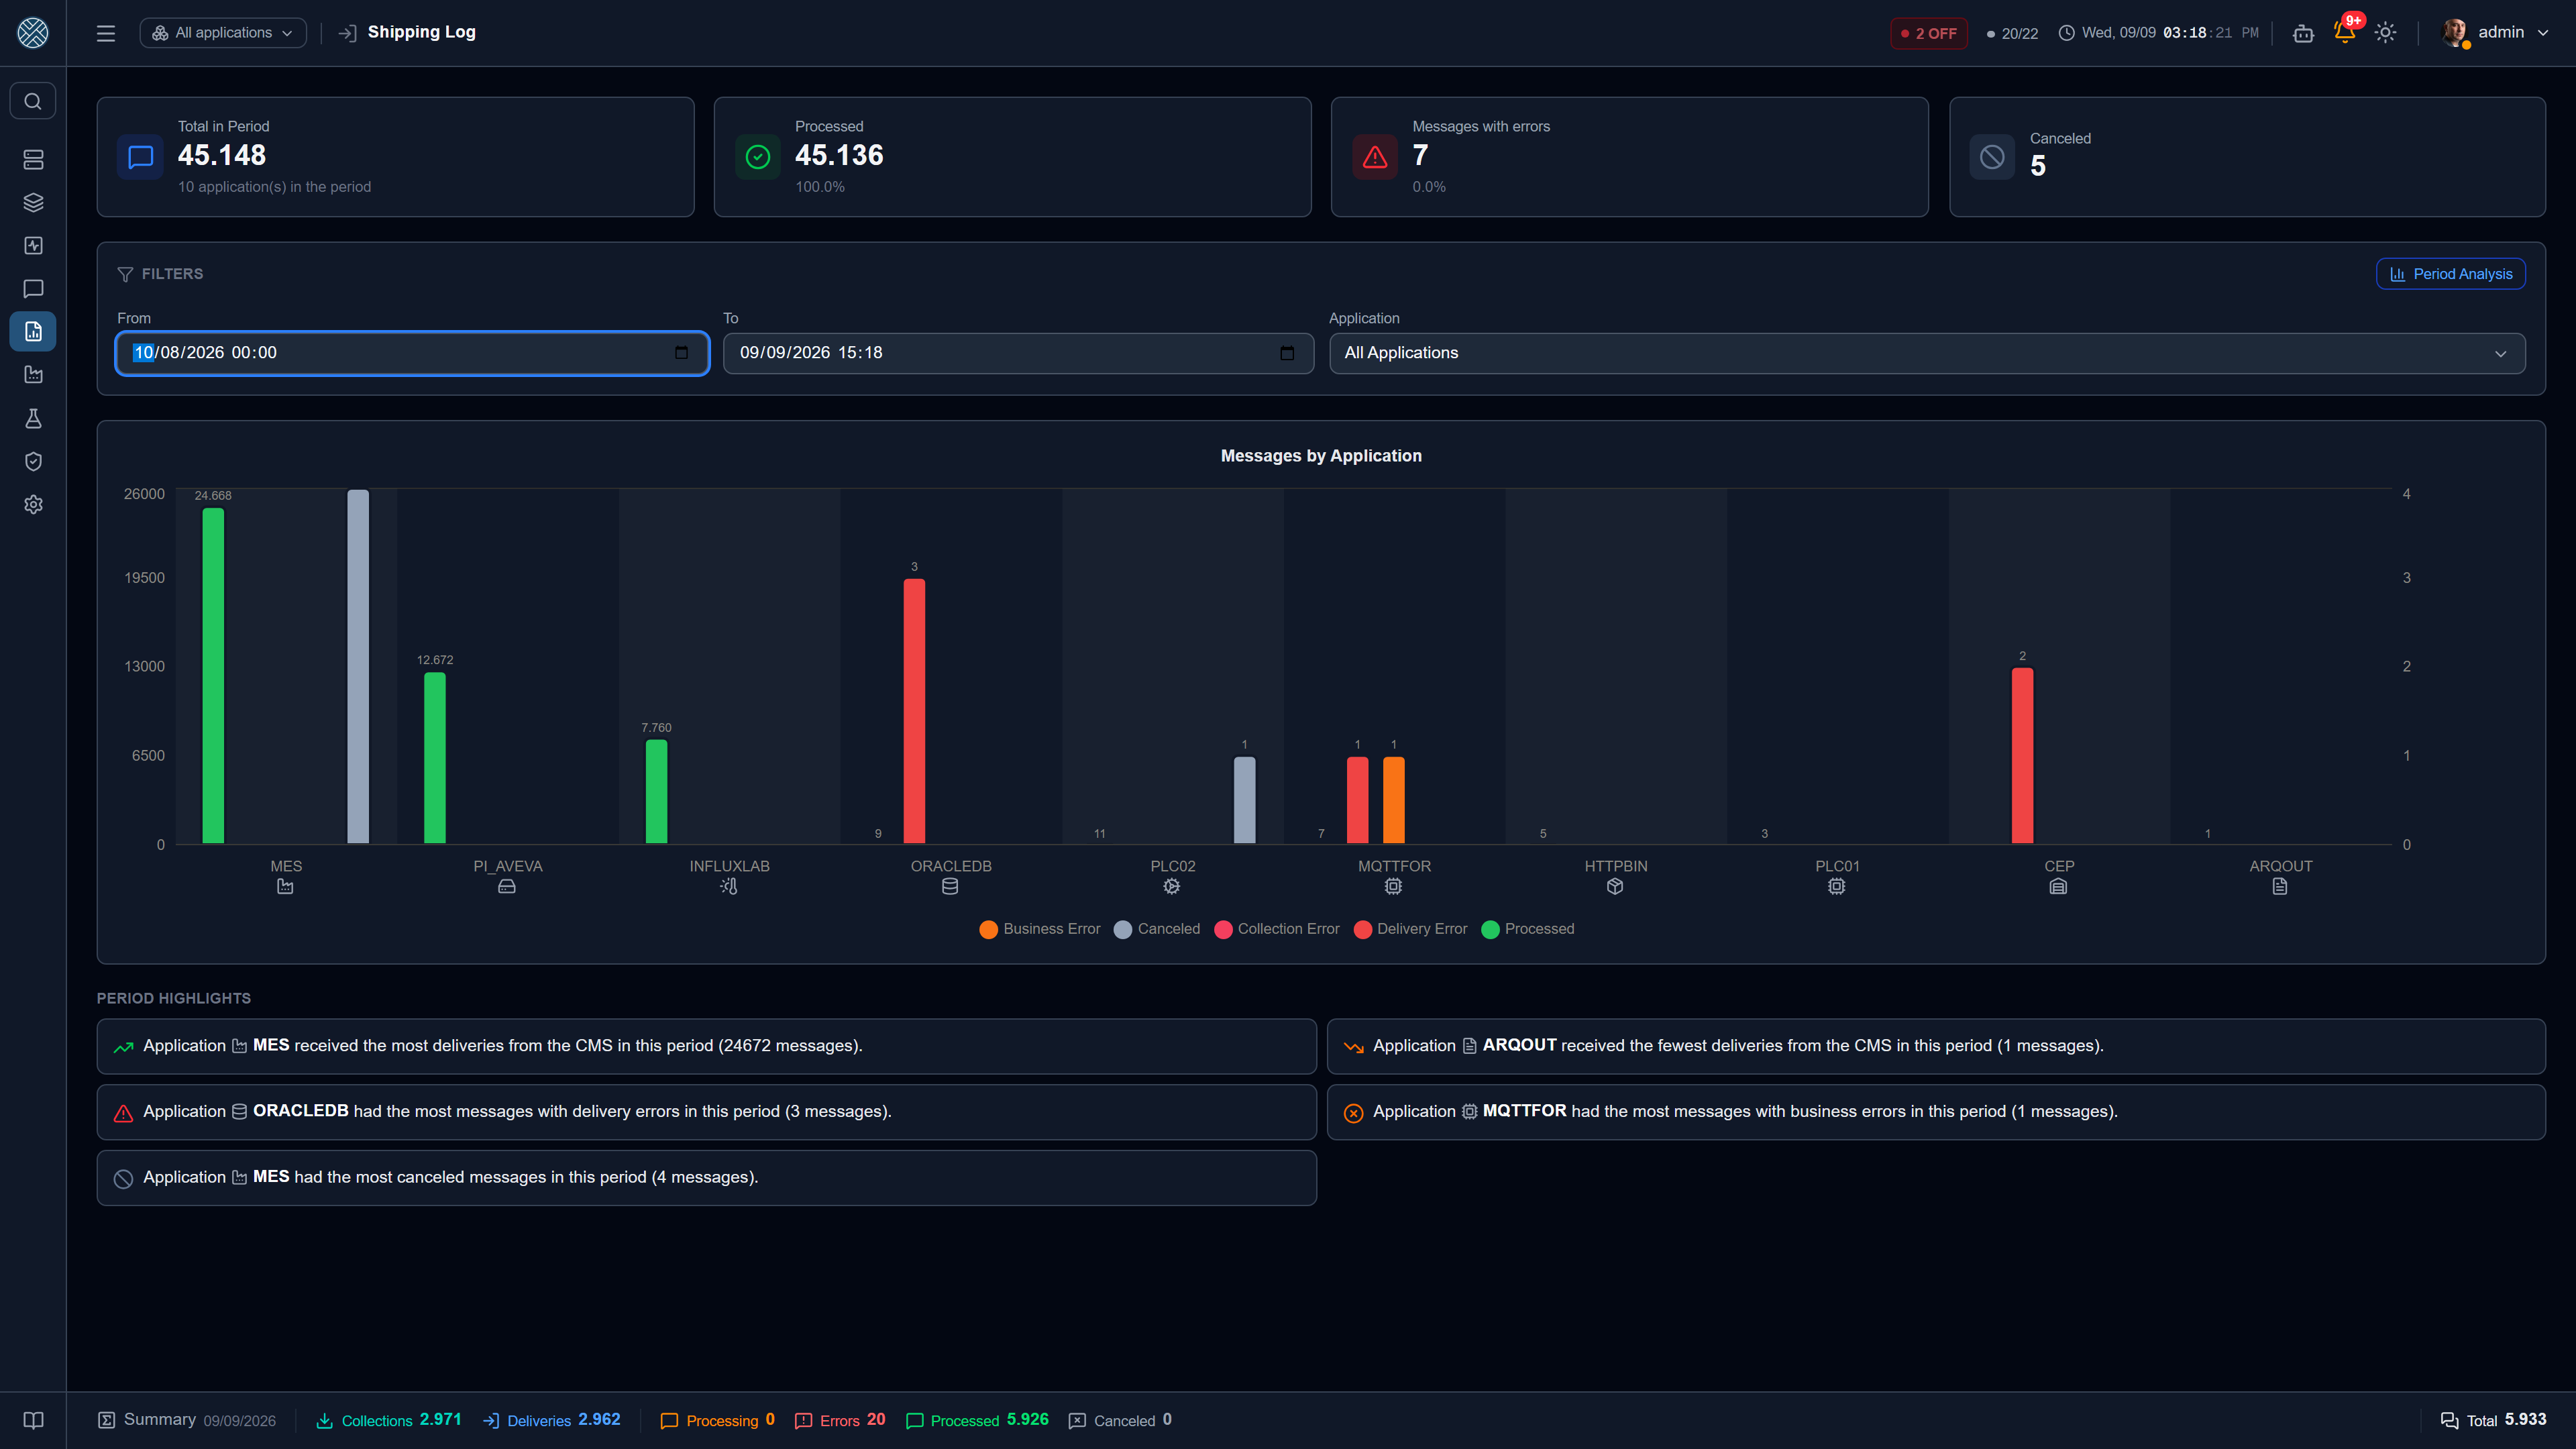
History of completed deliveries.
In both logs the period opens on This month — the shortcuts are the same as in Messages, plus “This month”.
Period Analysis
Both logs have a Period Analysis button, which swaps the list for a bar chart per day, stacked by status, over the same period and with the same filters.
It is the reading the list cannot give: where the list answers “did this message go through?”, the chart answers “which day did this start getting worse?”. Clicking a bar takes you to Messages already filtered on that day — with a confirmation first, because leaving the analysis loses the screen’s filters.
Definition Report — /reports/definicao/:tipo/:id
Consolidated view of one Collection or Delivery: source or destination, parameters, transformer, business errors, alerts, schedule, credential and who has access. It opens from the report icon in the Settings popup, under Message Definition, and is exportable as PDF — the format an integration is usually handed over in at the end of a project.
Audit Log — /reports/audit-log
Sensitive system actions — payload decryption, sending a credential, an API Key or an MCP token by e-mail, sending a message PDF, installing and removing the SAP SDK, installing a pack, and whatever an AI created through the MCP server — each with the user, outcome, denial reason, justification and IP. Detailed under Security.
Two families of event are worth knowing by name, because they are what you search for after an integration stops with no explanation:
| Event | Records |
|---|---|
ALTERAR_SIGLA_APLICACAO · ALTERAR_SIGLA_INTERFACE · ALTERAR_SIGLA_COLETA · ALTERAR_SIGLA_ENTREGA | Who changed a code that was already in use, with the previous and new value. The change moves public URLs, schedules and whatever identifies the Application in packs and automation — see The code, once it is in use |
COCKPIT_TOKEN_CRIADO · COCKPIT_TOKEN_ALTERADO · COCKPIT_TOKEN_REVOGADO · COCKPIT_TOKEN_REMOVIDO | The life cycle of Wallboard tokens. In an incident, the revoked one is what matters: when that TV stopped seeing |