Alerts — /alerts
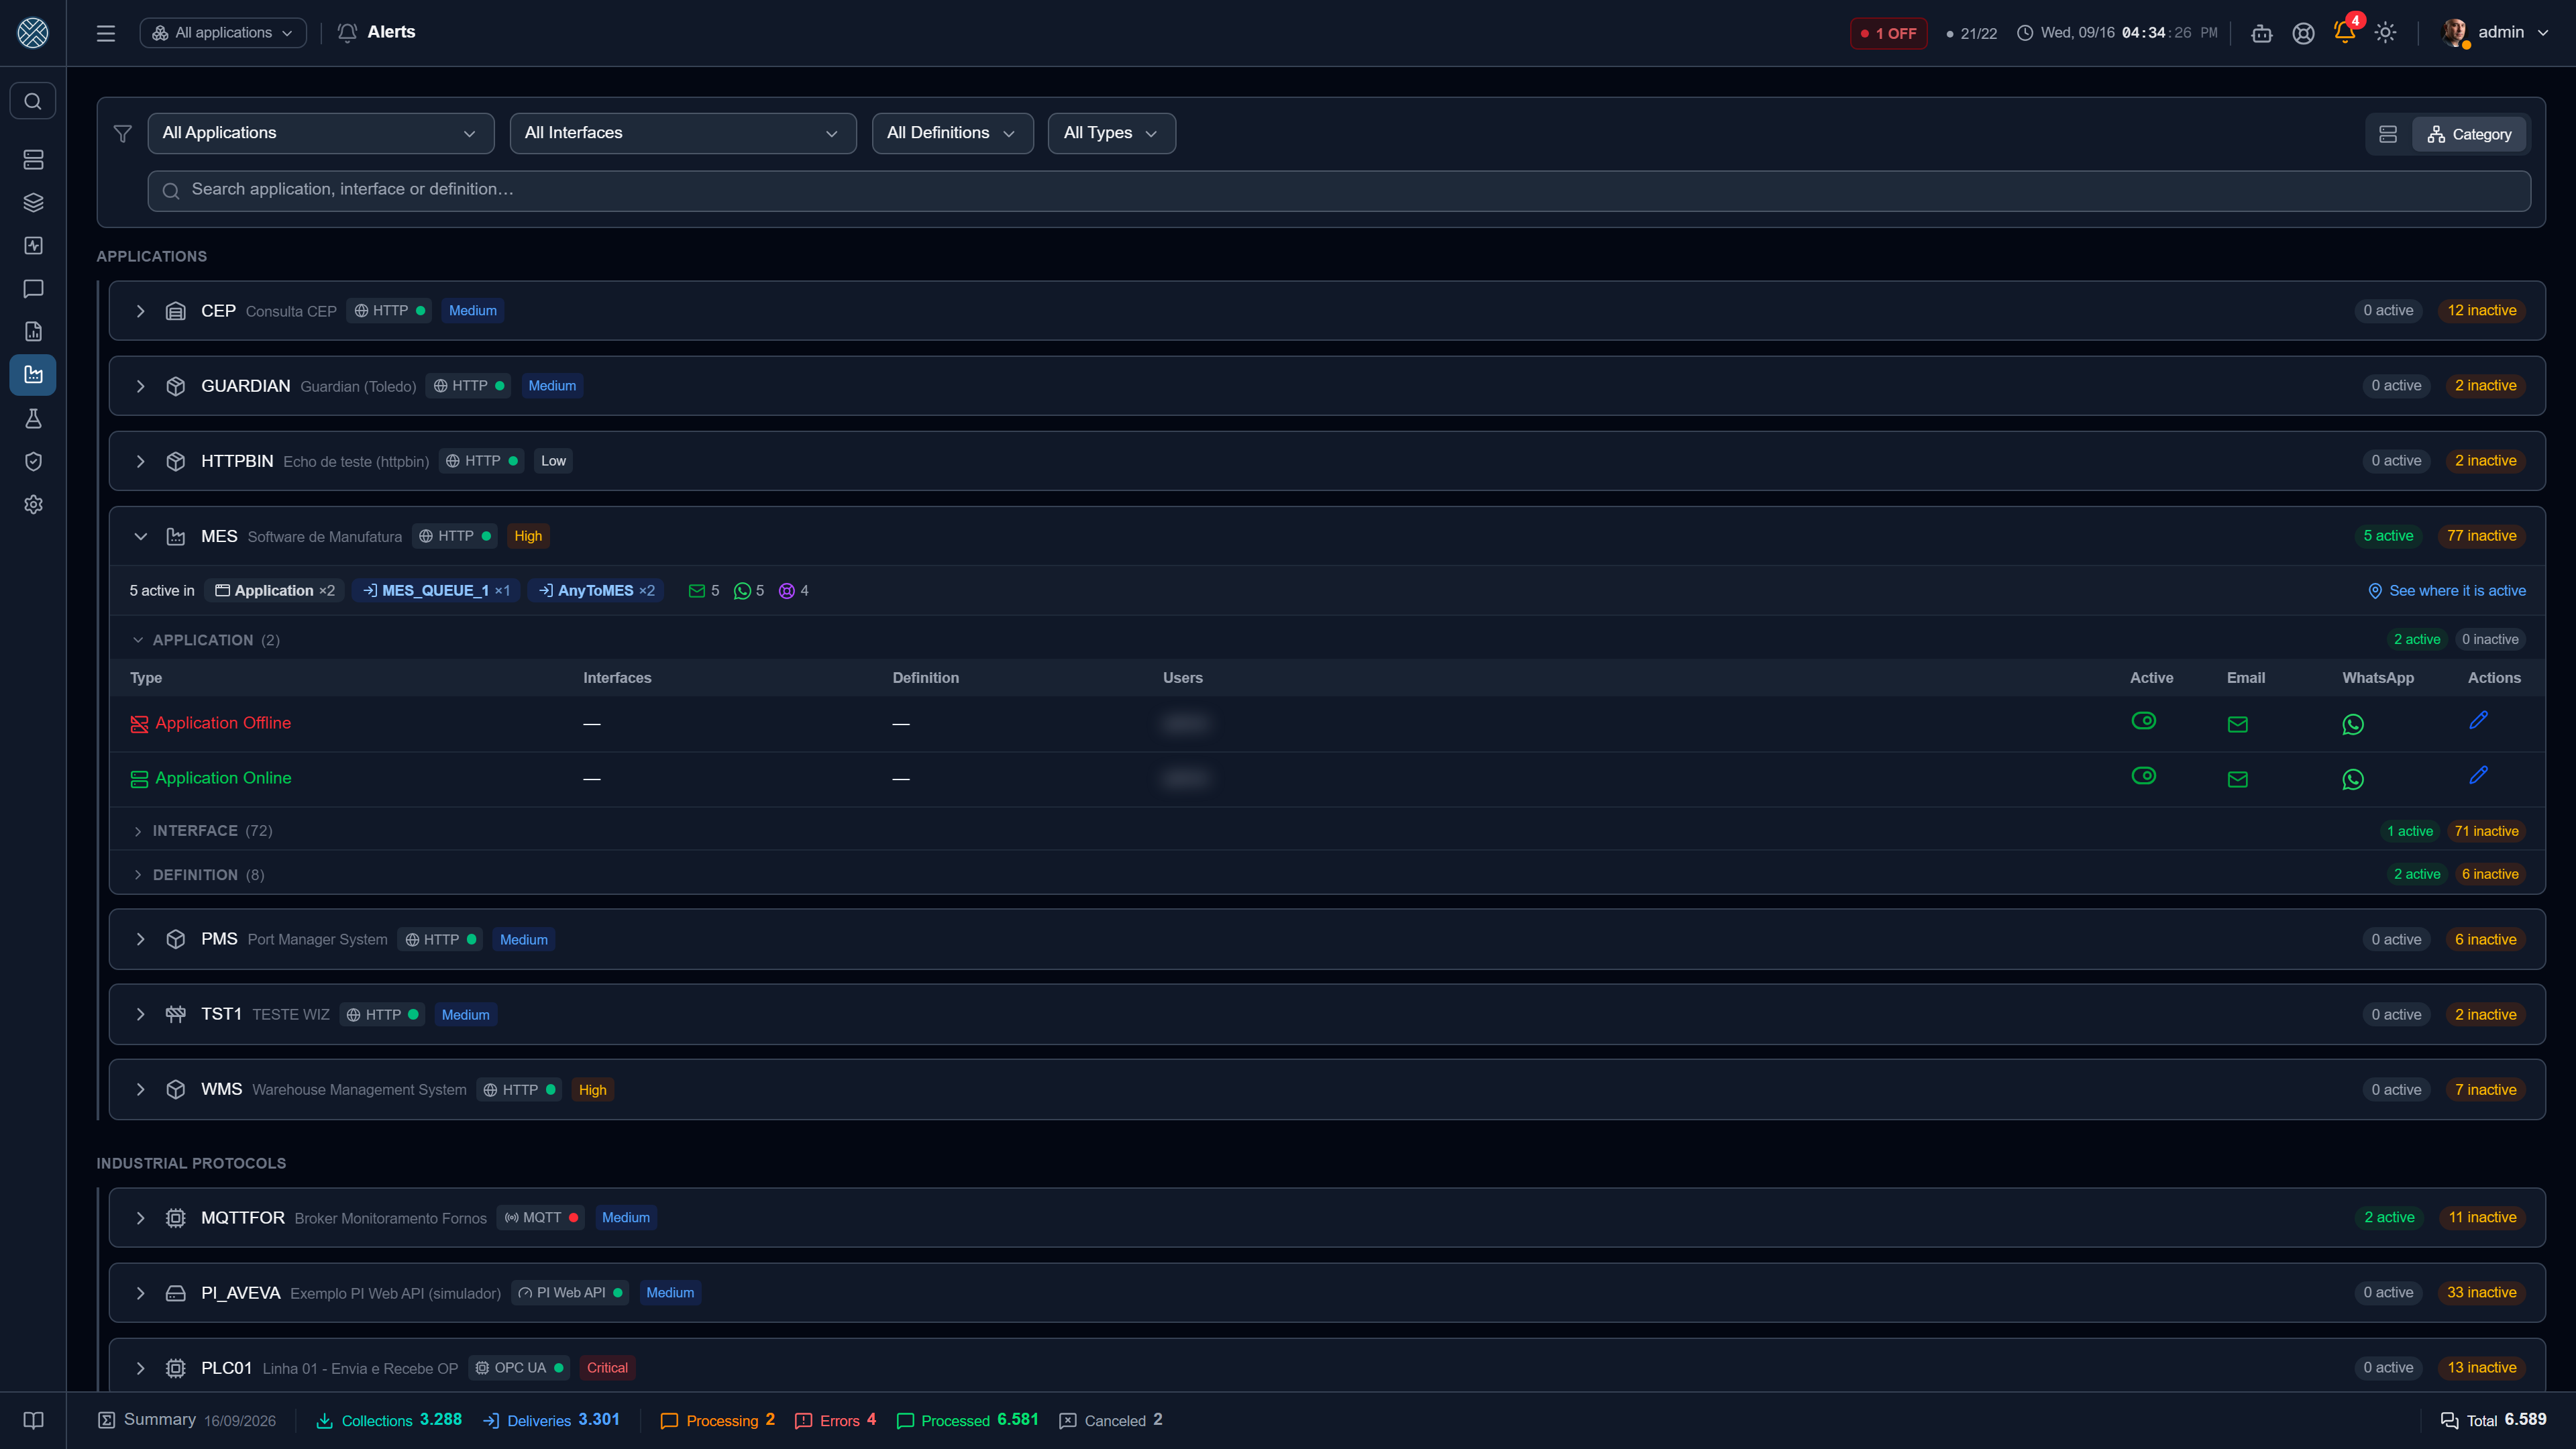
An integration that stops silently is worse than one that fails loudly. Alerts exist so silence stops being possible: every relevant CMS event can become a notification, an e-mail or a webhook, with recipients you choose.
How an alert is configured
An alert is the combination of four things:
- Event type — what has to happen.
- Scope — Application, and depending on the type also Interface and Definition.
- Recipients — which CMS users receive it.
- Channels — in-app notification (always), e-mail, webhook and/or a ticket in a Help Desk tool.
The combination type + application + interface + definition is unique: there are never two configurations competing over the same event. Trying to create the second one is refused with a clear message. The exception is Condition Met: each configuration has its own condition, and the same Collection can have several.
When you create an Application, Interface, Definition or Business Error, the CMS pre-registers the applicable alert configurations — disabled and with no recipients. They show up in the list waiting for someone to say who should be told, instead of having to be created from scratch.
Event types
Application level
These require no Interface: they apply to the whole application.
| Event | Fires when |
|---|---|
| Application Offline | The application’s keep-alive fails |
| Application Online | The application responds again |
The body of the application-offline alert includes, on separate lines, the notes registered on the Application and the error captured by the keep-alive. That turns an “it is offline” into something actionable: whoever receives the message already reads the owner’s phone number and the network error.
Interface level
| Event | Fires when |
|---|---|
| Interface Blocked | The interface is blocked, manually or by a business error |
| Interface Unblocked | The interface is released |
| Messages Queued in Interface | The queue passes the limit set on the Interface |
| Collection Error | A collection fails to read the source |
| Interface with Paused Scheduler | The interface’s scheduler is inactive |
| Connection Lost | The Collection’s persistent connection drops — MQTT, SAP IDoc, OPC UA or Modbus |
| Directory Unreachable | The folder of a file collection stopped responding |
| Sparkplug Device Offline | An edge node or device announced NDEATH / DDEATH |
Connection Lost and Sparkplug Device Offline are different things. The first is the broker going down; the second is the equipment going down with the broker up. Confusing them sends the wrong team to the wrong place.
Definition level
These also require the Definition, because what matters is knowing which integration failed:
| Event | Fires when |
|---|---|
| Delivery Error | A technical failure while delivering (network, timeout, HTTP error) |
| Business Error | The destination answered, but the answer matched a Business Error rule |
| Condition Met | The collected data started to meet the configured condition — Collections only. Going back fires Condition Normalized |
| iFlow failure (SAP CPI) | SAP CPI accepted the Delivery, but the iFlow ended in failure afterwards, inside the tenant — only Deliveries to a SAP CPI Application. See Status on SAP CPI |
Condition Met is the alert about the content of the reading: temperature above 80 for 5 minutes, status other than OK. It has fields of its own — the condition, Split by, the minimum duration and the message — and the firing rules are in Conditions on the data.
Delivery Error does not apply to Collection Interfaces. In a Collection, a read failure is Collection Error; the “definition error” that exists there is the Business Error. The screen refuses the invalid combination rather than creating an alert that would never fire.
Queued messages
The limit does not live on the alert but on the Interface (the queued-messages alert field). A
system scheduler — Check-msg-acumulada-alert — sweeps the interfaces every minute and fires the
alert for those over the ceiling. That is why this alert arrives up to a minute late, by design.
Recipients
Only users with “Accepts alerts?” ticked on their profile, and with access to the alert’s Application/Interface, appear in the list. If the list comes out empty, that is what is missing — the screen says so explicitly.
An alert can target several users; each receives their own copy, and read state is individual.
Channels
| Channel | How it works | Requirement |
|---|---|---|
| In-app notification | Bell in the header, with unread count | None |
| One message per recipient | SMTP in Settings → E-mail | |
| Webhook | A POST with the alert in JSON | Webhook enabled in Settings |
| Ticket | Opens a ticket in each destination picked in Open a ticket in | An activated tool and a destination — see Help Desk |
The in-app notification is always recorded — even with e-mail and webhook off, the alert stays in the history and in the bell. Each user sees their own unread items, can dismiss them one by one or mark them all as read.
The webhook, and what it solves
The channel labelled WhatsApp on the screen actually sends a POST to the URL configured in Settings — typically an automation (n8n, Power Automate, Zapier) that decides what to do with it. The body is standardised:
{
  "tipo": "APLICACAO_OFFLINE",
  "mensagem": "🔴 Application MES - Manufacturing Execution System is offline!\n...",
  "disparadoEm": "2026-08-26T13:40:02.145Z",
  "aplicacao": { "id": 1, "sigla": "MES", "descricao": "..." },
  "fila": null,
  "definicaoMensagem": null,
  "definicaoColeta": null,
  "contexto": { "erro": "connect ETIMEDOUT 10.0.3.7:8080" },
  "destinatarios": [
    { "id": 4, "nome": "...", "login": "...", "email": "...", "telefone": "..." }
  ]
}
Note that the recipients’ phone numbers travel in the payload: that is what lets the automation fire WhatsApp, SMS or a phone call without querying the CMS. The endpoint accepts optional Basic Auth.
Because the payload carries contact data, point the webhook only at an endpoint under your control. It leaves the CMS with everything the automation needs to reach people.
Ticket
The Open a ticket in field picks which ticket destinations the alert opens a ticket in — each destination with the tool’s icon, acronym and description, so there is no doubt about which system it will open in. An alert can open in more than one destination at the same time.
The list leaves out destinations marked Available for manual opening: those belong to the Open ticket button on a failed message, with fields an operator fills in. A destination already linked stays in the list, so it can be turned off.
On Application Offline, Only open a ticket after (minutes) also shows up, with 5 as the default: the e-mail goes out immediately, and the ticket only if the Application is still down after that time. Deduplication, the recovery alert and what happens when the tool itself goes down are in Help Desk.
Finding what is active
An Application piles up dozens of pre-registered, disabled alerts, and the few active ones get lost among them. Three features answer “where is it switched on?” without opening row by row:
- Count per level. The Application, Interface and Definition groups show, on the right, how many alerts are active and inactive — in the same column as the Application counters. Running your eye down the list shows which level the active ones are at.
- Summary of the open Application. A band at the top shows where the active ones are, with one badge per place — the Application itself, each Interface, each Definition, with the count — and which channels they notify through: e-mail, WhatsApp and ticket.
- See where it is active. The band’s button, or the green counter on the Application header (no need to expand it), opens a popup with the active alerts grouped by the place they apply to, with the channels, the ticket destinations, the recipients and the pencil that opens editing.
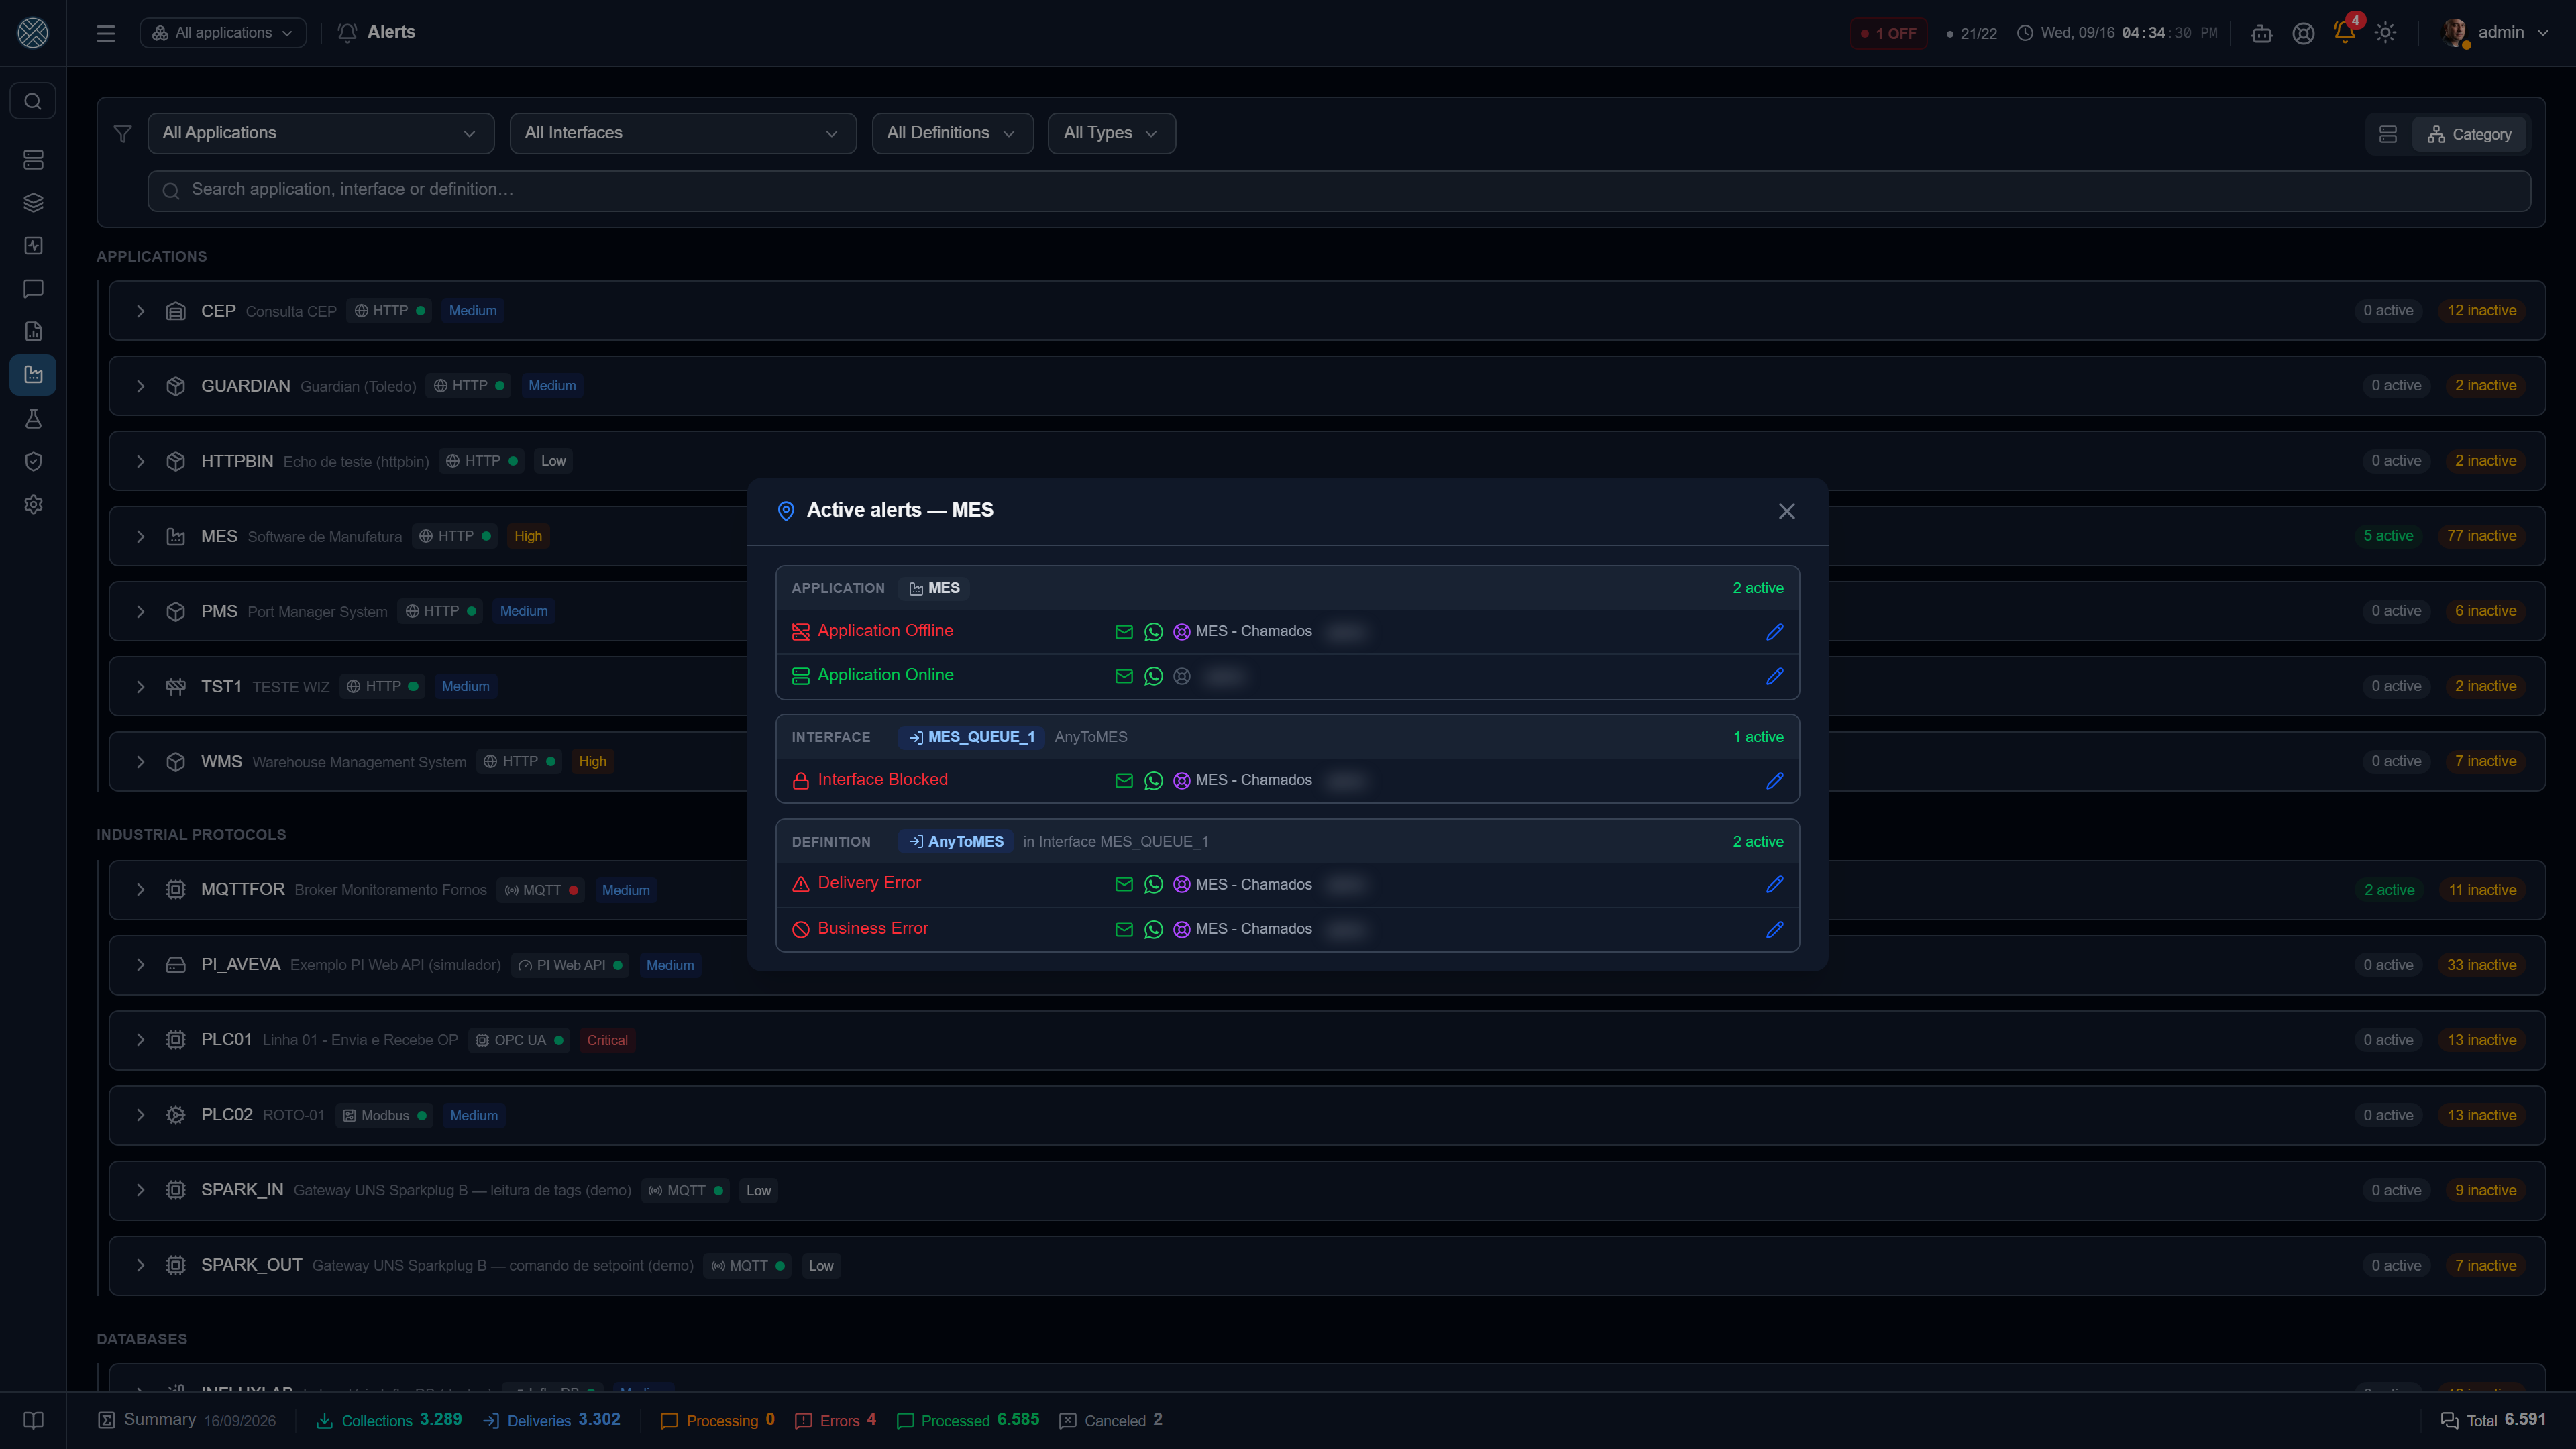
The count, the band and the popup respect the screen’s filters and search.
Where else alerts show up
- In the header bell, with an unread count.
- On the Applications Panel and the Cockpit, as a sound alert and a blinking tab title when a monitored application goes down.
- On the Definitions screen, where that definition’s alerts can be configured without coming here.
Permission
The Tool is /alerts. Like every Application-grouped screen, the user only sees alerts of the
Applications and Interfaces they have access to.